Sniffer4D Mini2 Gas Detection System
Price on Request
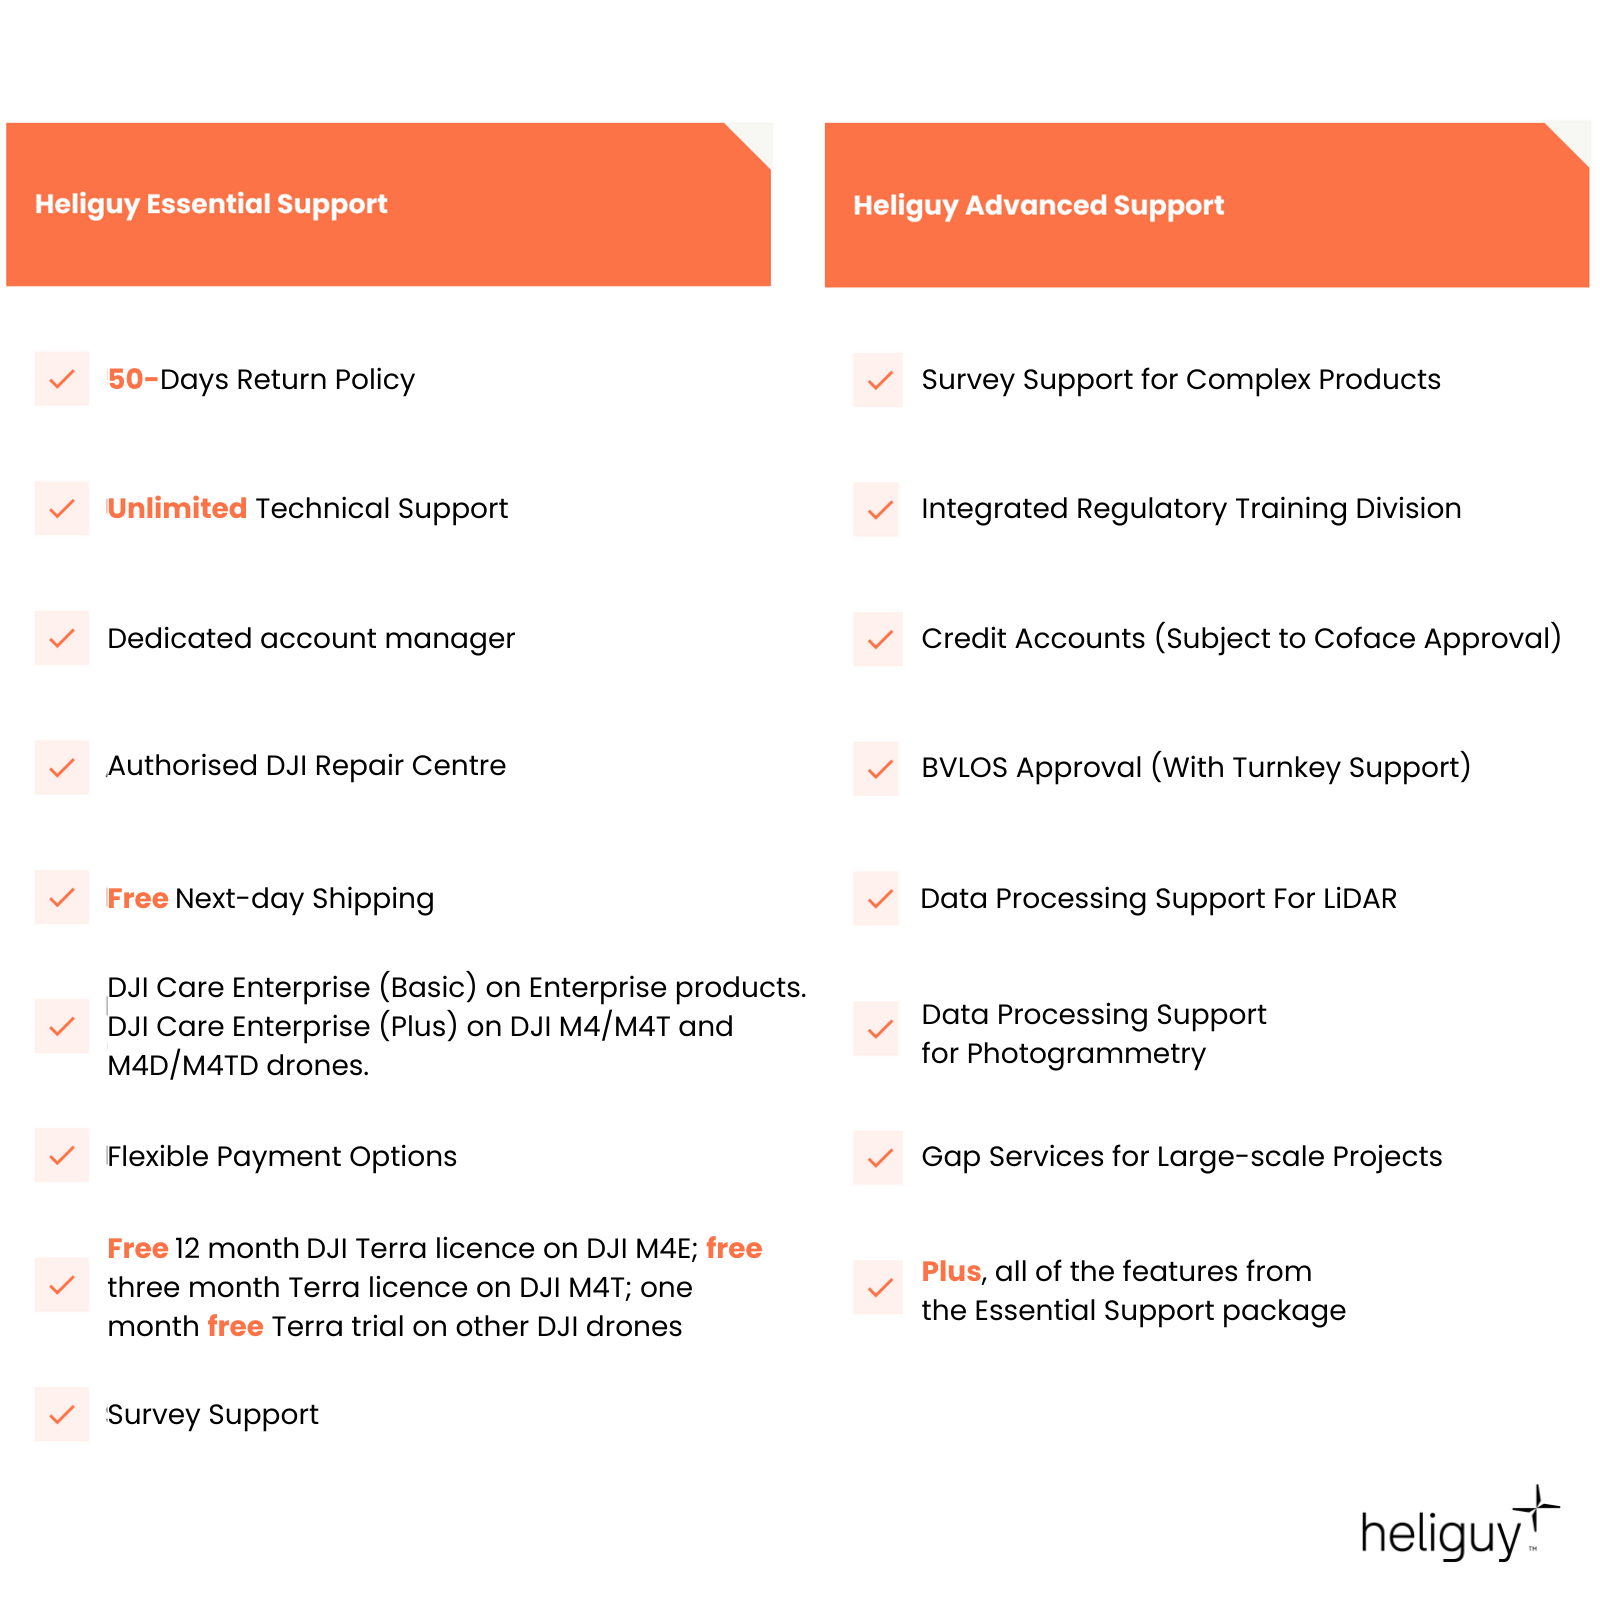
50-days return policy
Next-day delivery - order before 3 pm
The Sniffer4D Mini2 is a hyper-local multi-gas detection and mapping system for DJI drones that can measure and visualise real-time 3D gas concentration distributions. It can be used for ambient air monitoring, HazMat response, and oil and gas plant leak detection.
Multi-gas Detection Detect up to 9 gas conecton distributions at one time. Flexibly choose or change sensor configurations.
Vast Compatibility Deploy with the DJI M350 and M300 RTK the DJI M30 Series, including DJI Dock, and the DJI Mavic 3 Enterprise and Mavic 3 Thermal.
Analytics Software Combine with the Sniffer4D Mapper software to visualise and analyse data from one or more Sniffer4Ds in real-time.
Overview
Contents
Specifications
Support
FAQ
Heliguy Services
Sniffer4D Mini2 Key Feeatures
Multi-gas detection and mapping system
Detect up to 9 gas concentration distributions in real-time.
Seamless integration with DJI M350/M300 RTK Series, M30 Series, and Mavic 3 Enterprise/Thermal drones.
Compact body and ultra-lightweight - weighing between 250g and 300g.
Active air intake.
Built-in 3G/EDGE/GPRS.
Data retrieval algorithm.
Supports up to 4 externally-mounted modules.
Software suite for enhanced insights.
SD card data storage.

Detect Up To 9 Gases At A Time
Real-time drone gas detection
Sniffer4D can obtain up to 9 gas concentrations at one time. Users can flexibly choose or alter their sensor configurations that suit their applications and budgets.
Examples:
For Ambient Air Monitoring: PM2.5, PM10, O3, NO2, CO, SO2, TVOC, Odour (OU)
For HazMat Response: TVOC, CH4, CO, Cl2, O2, NO2, H2S, CO2.
For Oil & Gas Plant Leak Detection: TVOC, CH4, H2S, SO2.
Available parameters include: PM2.5, PM10, SO2, CO, NO2, O3, TVOC, LEL, CH4, CO2, HF, H2S, NH3, HCI, H2, Cl2, PH3, NO, HCN, Odour (OU), and HCHO.
Contact heliguy™ to discuss compatible module set-ups tailored to your operational requirements.

Compact Module. Powerful Results
Expanded capability and enhanced efficiency
Expansion Modules: Connect up to four externally-mounted modules, helping to expand user applications. These modules include a 1ppm NDIR CO2 sensing module, a 1ppm TDLAS methane sensing module, a nuclear radiation sensing module, and an ultrasonic wind speed and direction-sensing module.
Status LEDs: The 6 status LEDs enable users to quickly understand Sniffer4D Mini 2's working status, boosting efficiency.
Warning Lights: The 3 warning lights on Sniffer4D Mini2 have a larger visible angle. They change colour under different gas concentrations, notifying nearby people about the risks.
Compact Module: Sniffer4D Mini2's reduced size and weight maximise the drone's flight time. The new quick-release mount and cable connection further shorten operation preparation time.
DJI FlightHub 2 Supported: Sniffer4D Mini2 offers seamless integration with DJI FlightHub 2, enabling real-time reading display and device control through a PSDK connection.

Advanced Real-time Visualisation
Sniffer4D Mapper Software
The Sniffer4D software suite visualises and analyses data from one or more Sniffer 4Ds in real-time, providing insightful and actionable data.
Concentration Distribution Mapping: Visualises data using 2D grid, 2D isoline, and 3D point cloud maps. Benefit from one-click result delivery.
Real-Time Monitoring: Provides a real-time concentration map for identifying hotspots and assessing their impact. Also obtain a real-time drone camera view.
Historical Data Analysis: Allows analysis of daily, weekly, monthly, and annual data for user-defined locations of interest.

Accreditation
![UK CAA Recognised Assessment Entity (RAE)]()
UK CAA Recognised Assessment Entity (RAE)
Authorised GVC/A2 CofC Training Courses
![UK CAA Permission for BVLOS Flights: Operational Authorisation UAS 15435]()
UK CAA Permission for BVLOS Flights: Operational Authorisation UAS 15435
Helping companies unlock BVLOS missions in an AAE with DJI Docks
![The UK's only DJI Gold and S-Level Partner]()
The UK's only DJI Gold and S-Level Partner
Trusted supply on DJI products
![ISO 9001 Certification]()
ISO 9001 Certification
Driving industry standards through robust operational protocols for enhanced safety and reliability
![Training Qualifications UK]()
Training Qualifications UK
Accredited training courses endorsed by TQUK.
![Ofqual-regulated Training]()
Ofqual-regulated Training
Recognised quality mark for meeting accreditation criteria.
![Cyber Essentials]()
Cyber Essentials
Verified data security
![Financial Conduct Authority]()
Financial Conduct Authority
Authorised to conduct regulated financial services
![Armed Forces Covenant Defence Employer Recognition Scheme - Silver Award]()
Armed Forces Covenant Defence Employer Recognition Scheme - Silver Award
Proud supporter of our Armed Forces
![D-U-N-S Registered: 77-916-1210]()
D-U-N-S Registered: 77-916-1210
Verified to conduct international business


