Products
Stockpile Surveys Streamlined With New Terrasolid LiDAR Tool
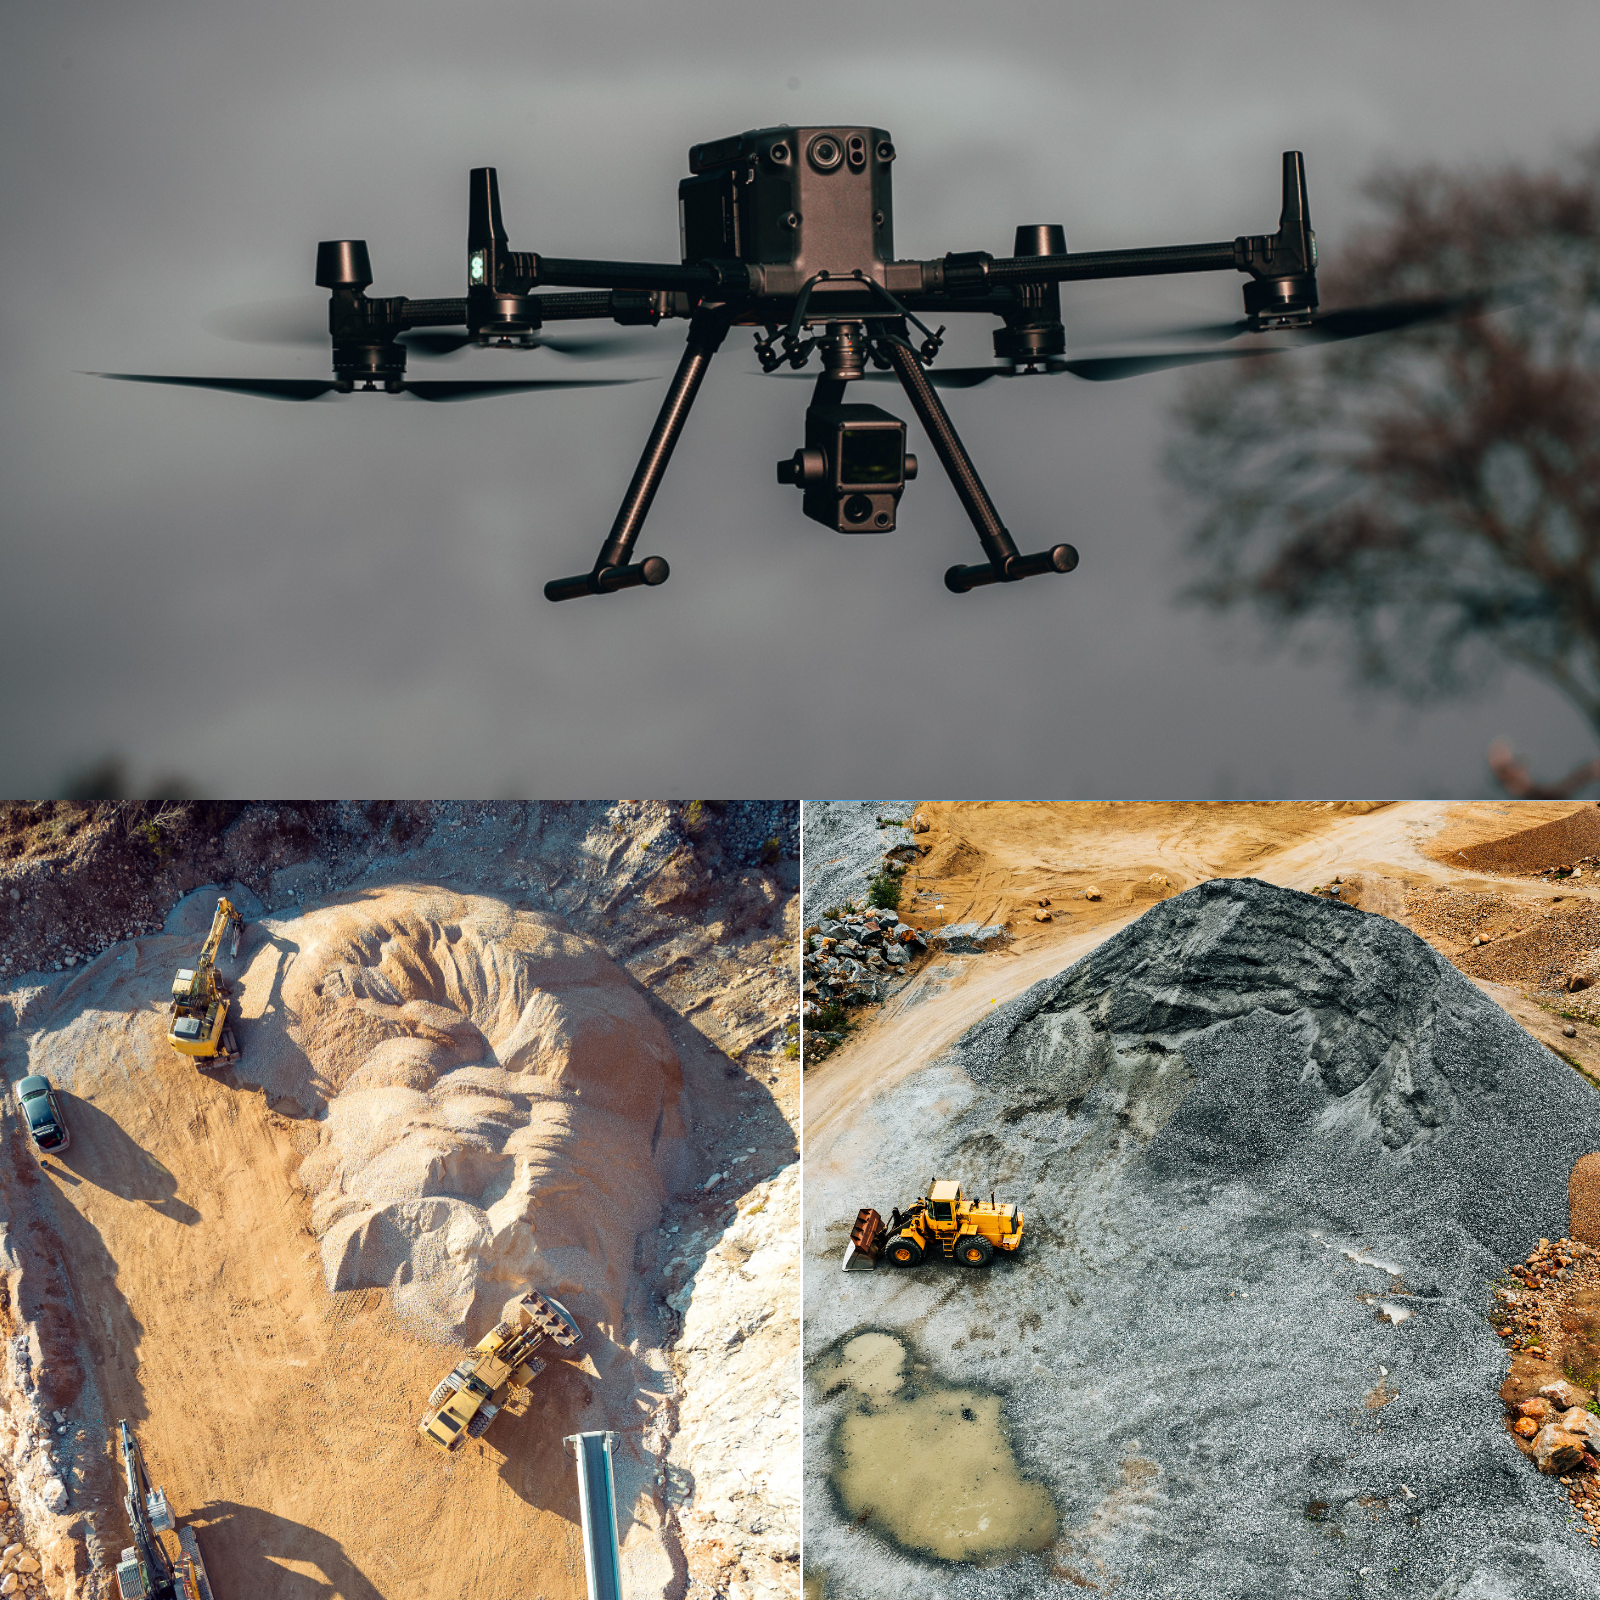
A new tool has been added to Terrasolid's TerraModeler application to streamline stockpile volumetrics with a LiDAR point cloud, including data collected with the DJI Zenmuse L1. Find out how the software simplifies stockpile management and ... Read More
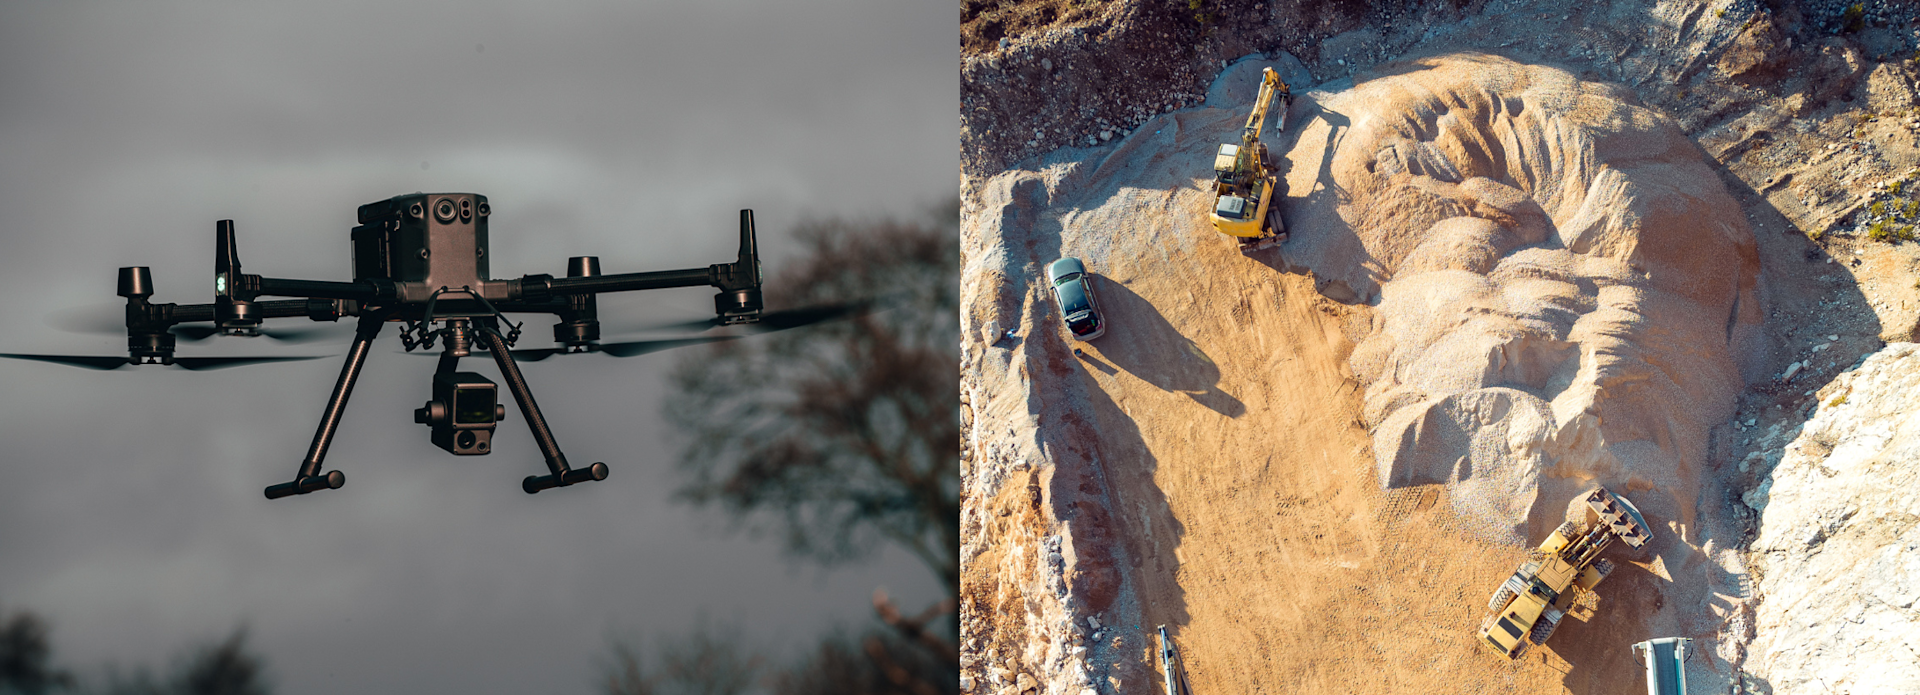
New tool added to Terrasolid's TerraModeler application to streamline stockpile measurements using a LiDAR point cloud;
Learn about the workflow to conduct stockpile volumetrics in TerraModeler, using data collected with the DJI Zenmuse L1 as an example;
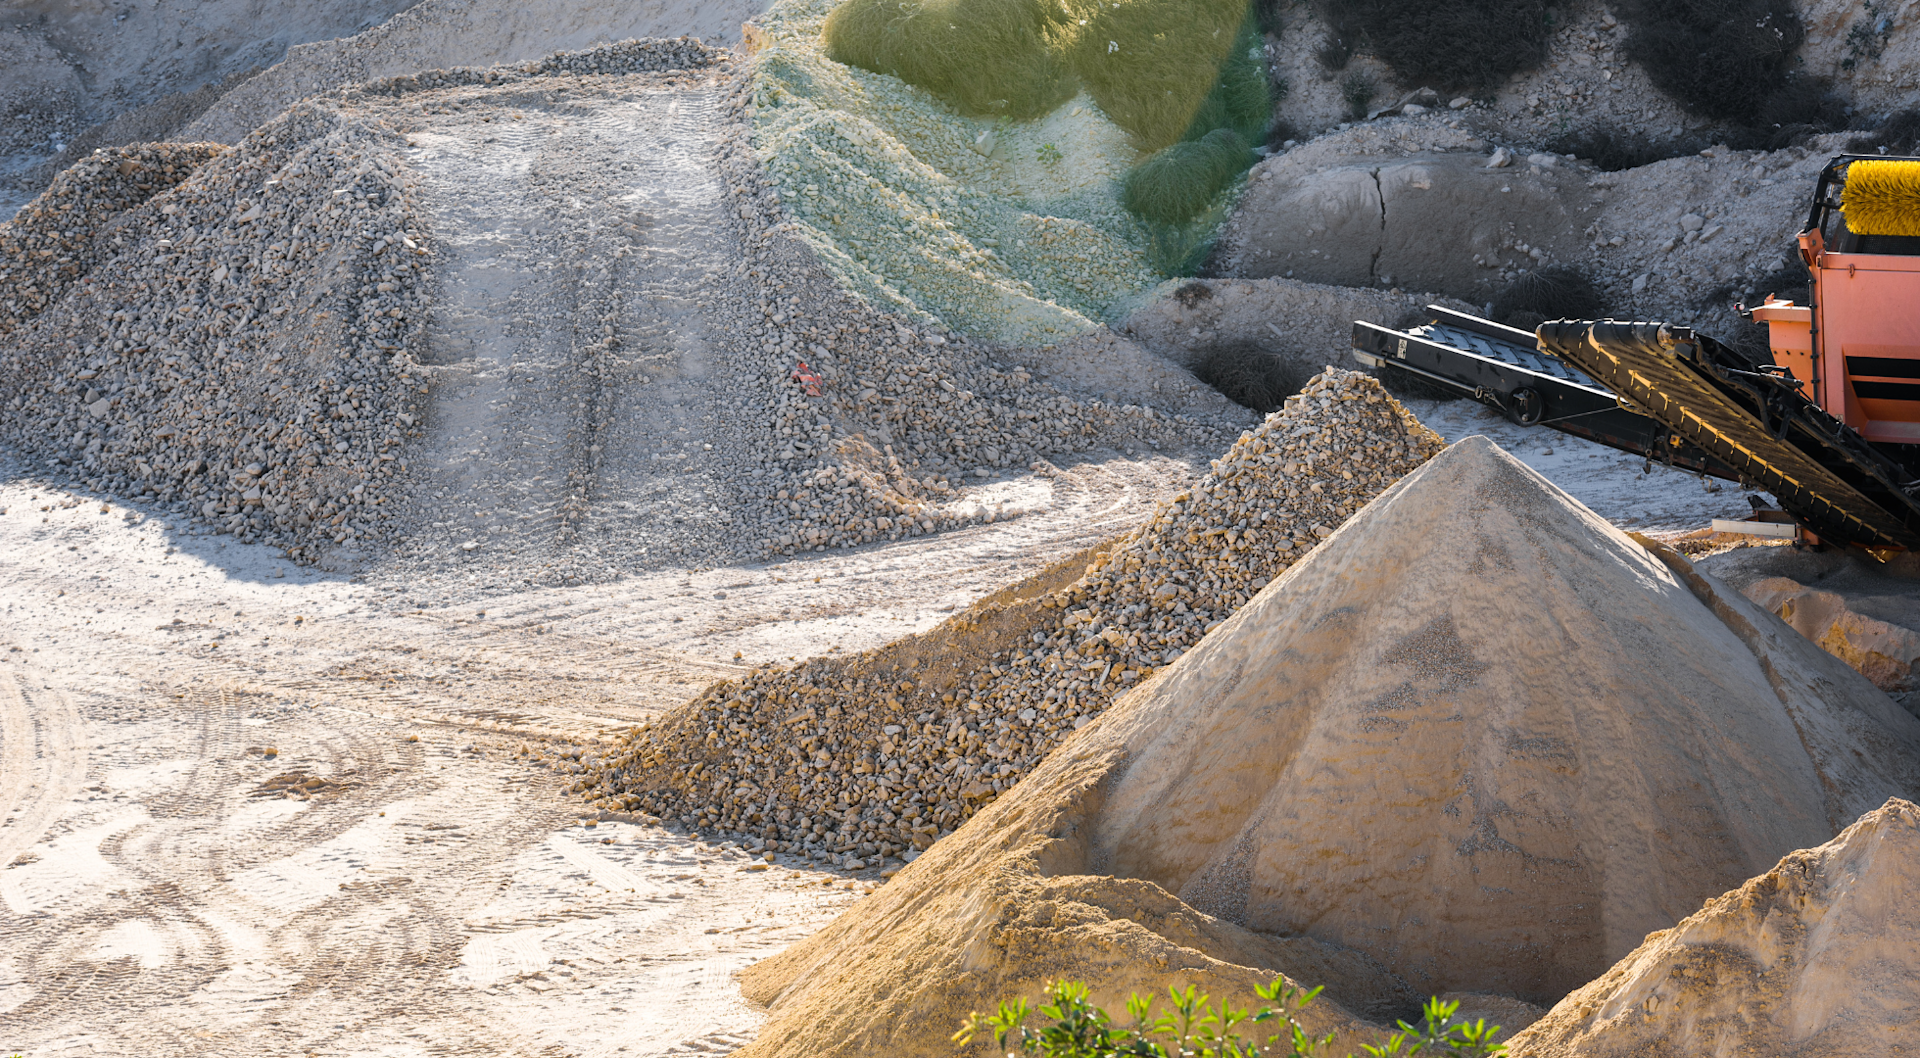
Stockpile calculations are important, helping AEC and mining companies keep on top of inventory levels and potential risks.
A new tool has been added to Terrasolid to streamline the process of measuring stockpile volumes from a LiDAR point cloud, including data from the DJI Zenmuse L1.
Stockpile insights are important, providing crucial information into inventory levels, trends, and potential risks, enabling effective decision-making and efficient resource management. Using a drone to collect this data is more efficient and safer than manual methods.
The new tool is available within all versions of Terrasolid's TerraModeler application, including the UAV version.
In this blog, we’ll explore the benefits of using this feature to extract important stockpile data and highlight the workflow to streamline the process.
Simplifying Stockpile Volumetrics With TerraModeler
TerraModeler already features a more complex volume computation tool, with more options and more capabilities, but it does have more preparation requirements for generating results.
But now, the new tool offers a more simple method for computing stockpile volumetrics directly from a LiDAR point cloud.
It can compute the volume without any triangulated models - known as TINS. This means that the top surface can be a TIN model, if desired, or for ease, a TIN model can be bypassed and selected classes of points can be loaded into TerraScan - the main application in the Terrasolid Software family for managing and processing all types of point clouds.
The UAV packages available includes a bundle, combining TerraScan and TerraModeler.
In fact, the only thing required is a point cloud and a 2D polygon which is drawn around the stockpile(s).
It can be used to measure one or multiple stockpiles, set areas where the mound exceeds a specific height, and generate reports.
Volume Tool: Workflow
We'll now highlight the workflow and the highlights of the new tool, including how to obtain volumetrics for a single stockpile and multiple piles.
The examples shown are using drone data collected with the DJI Zenmuse L1.
Measuring A Single Stockpile
Using this data set, we will analyse the volumetrics of one stockpile on this site.
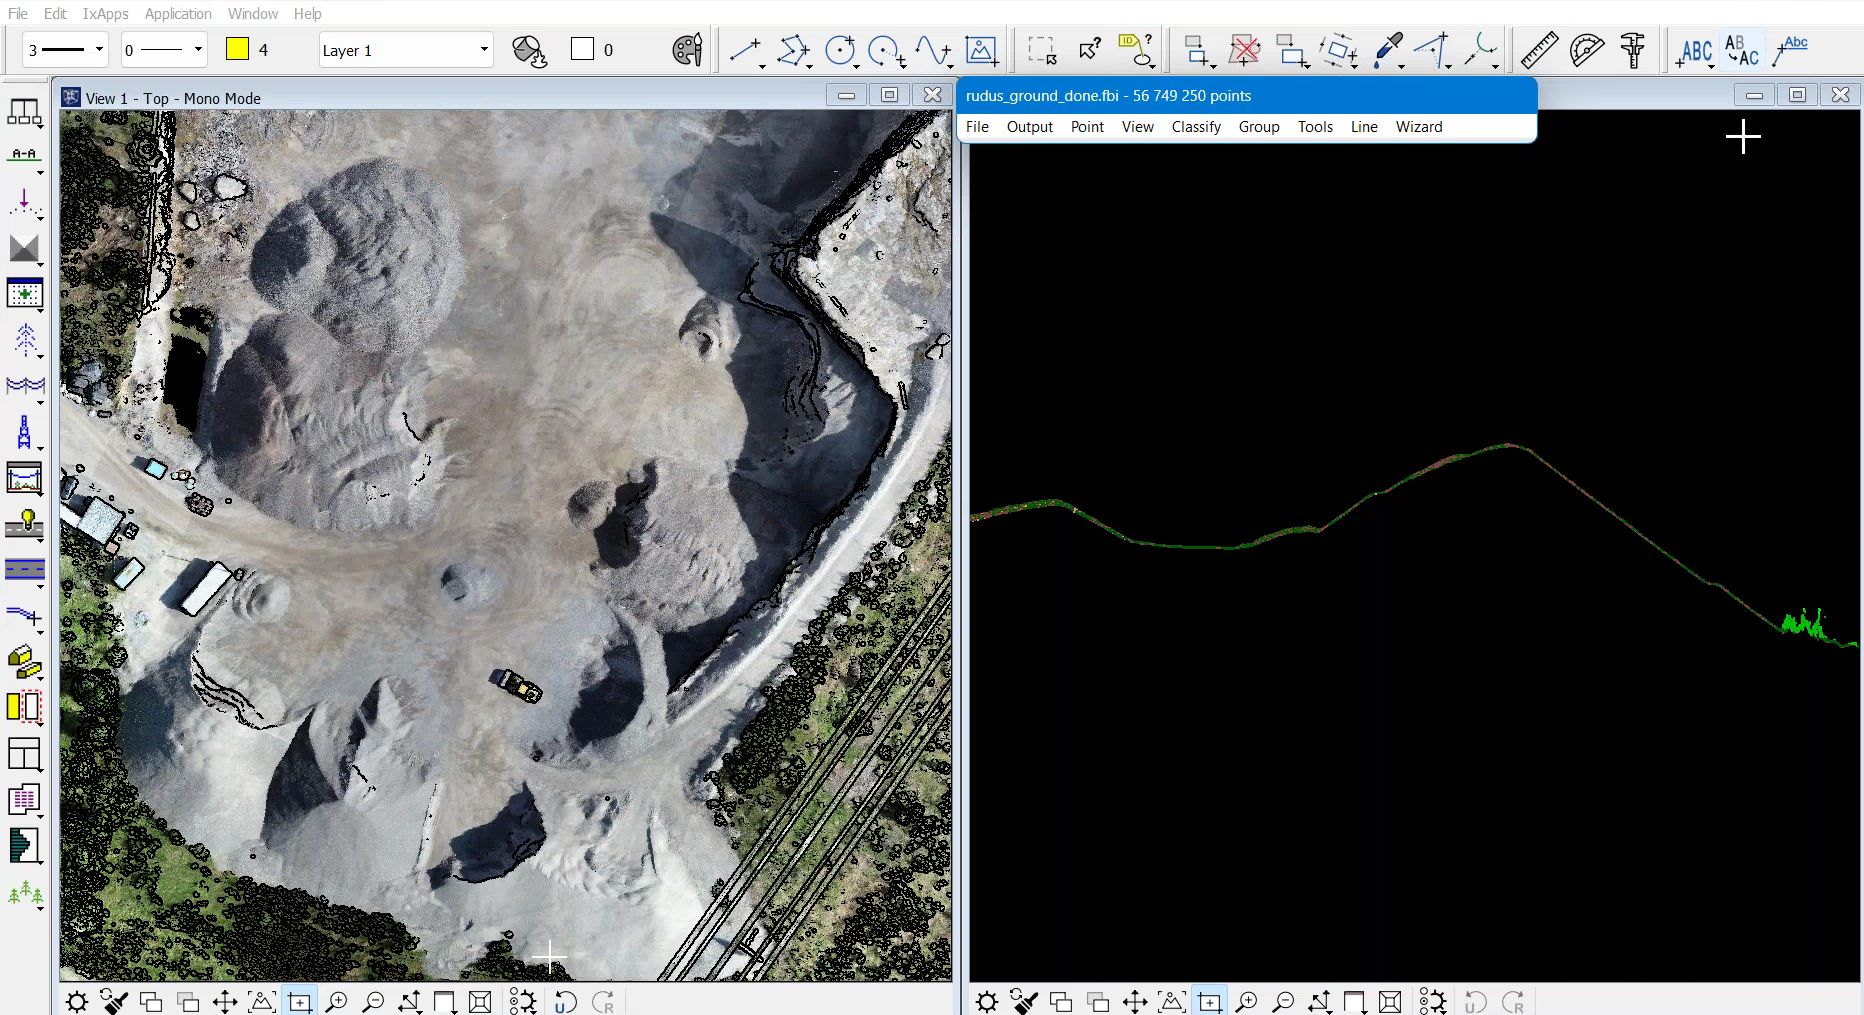
As part of processing the data, the following steps have already been taken:
Split trajectories
Match flight passes
Cut overlap
Smoothen and remove noise
Classify ground
Check ground
Classified the height from ground
In this example, there are 5.7million points in the ground. There are also a lot of points in low vegetation, as well as points in medium and high vegetation, and some points classified as low points.
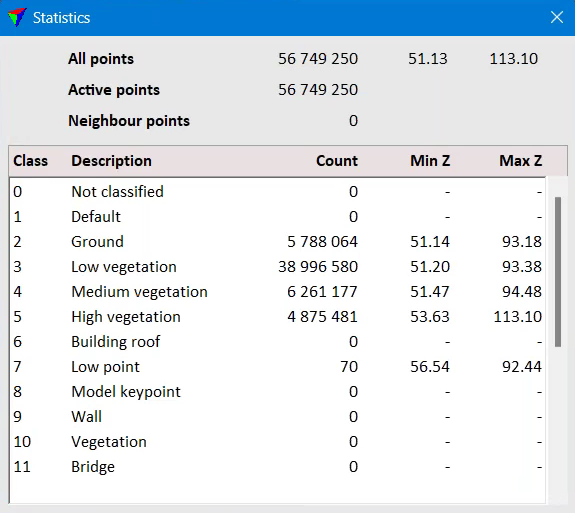
In TerraModeler, there are no surfaces created.
Therefore, the simplest stockpile volume computation would go like this:
1: Change the shading...
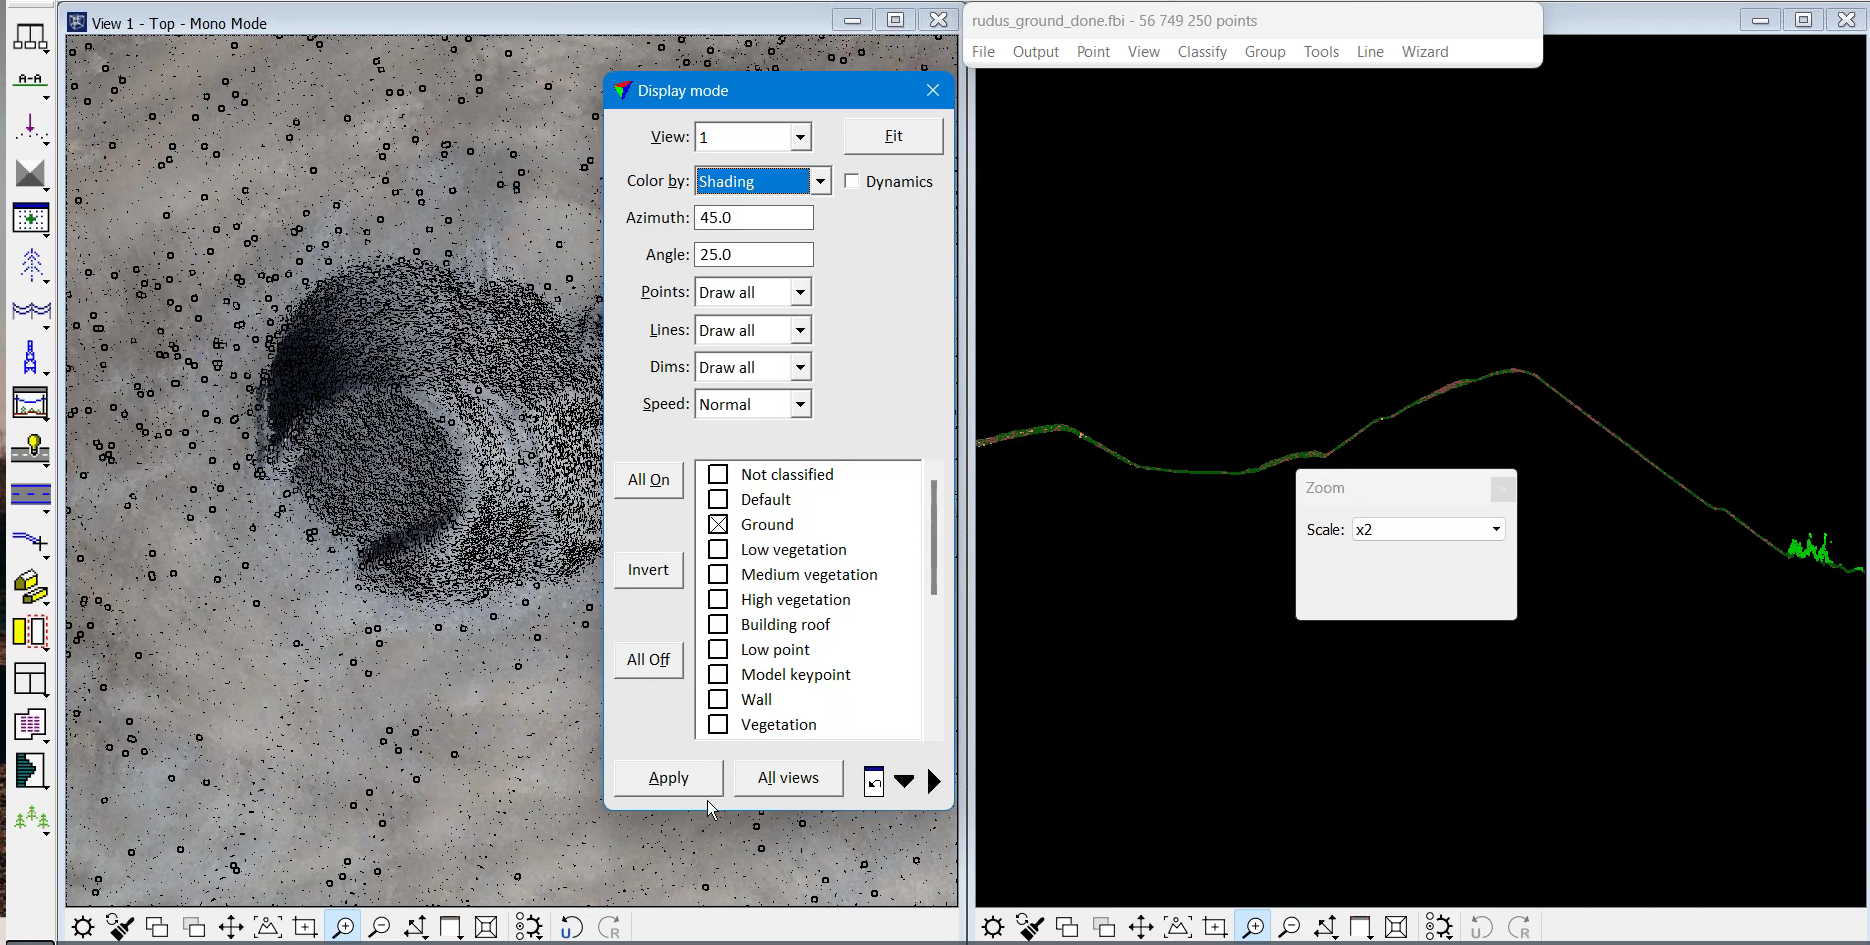
...so that you can see the shape of the stockpile.
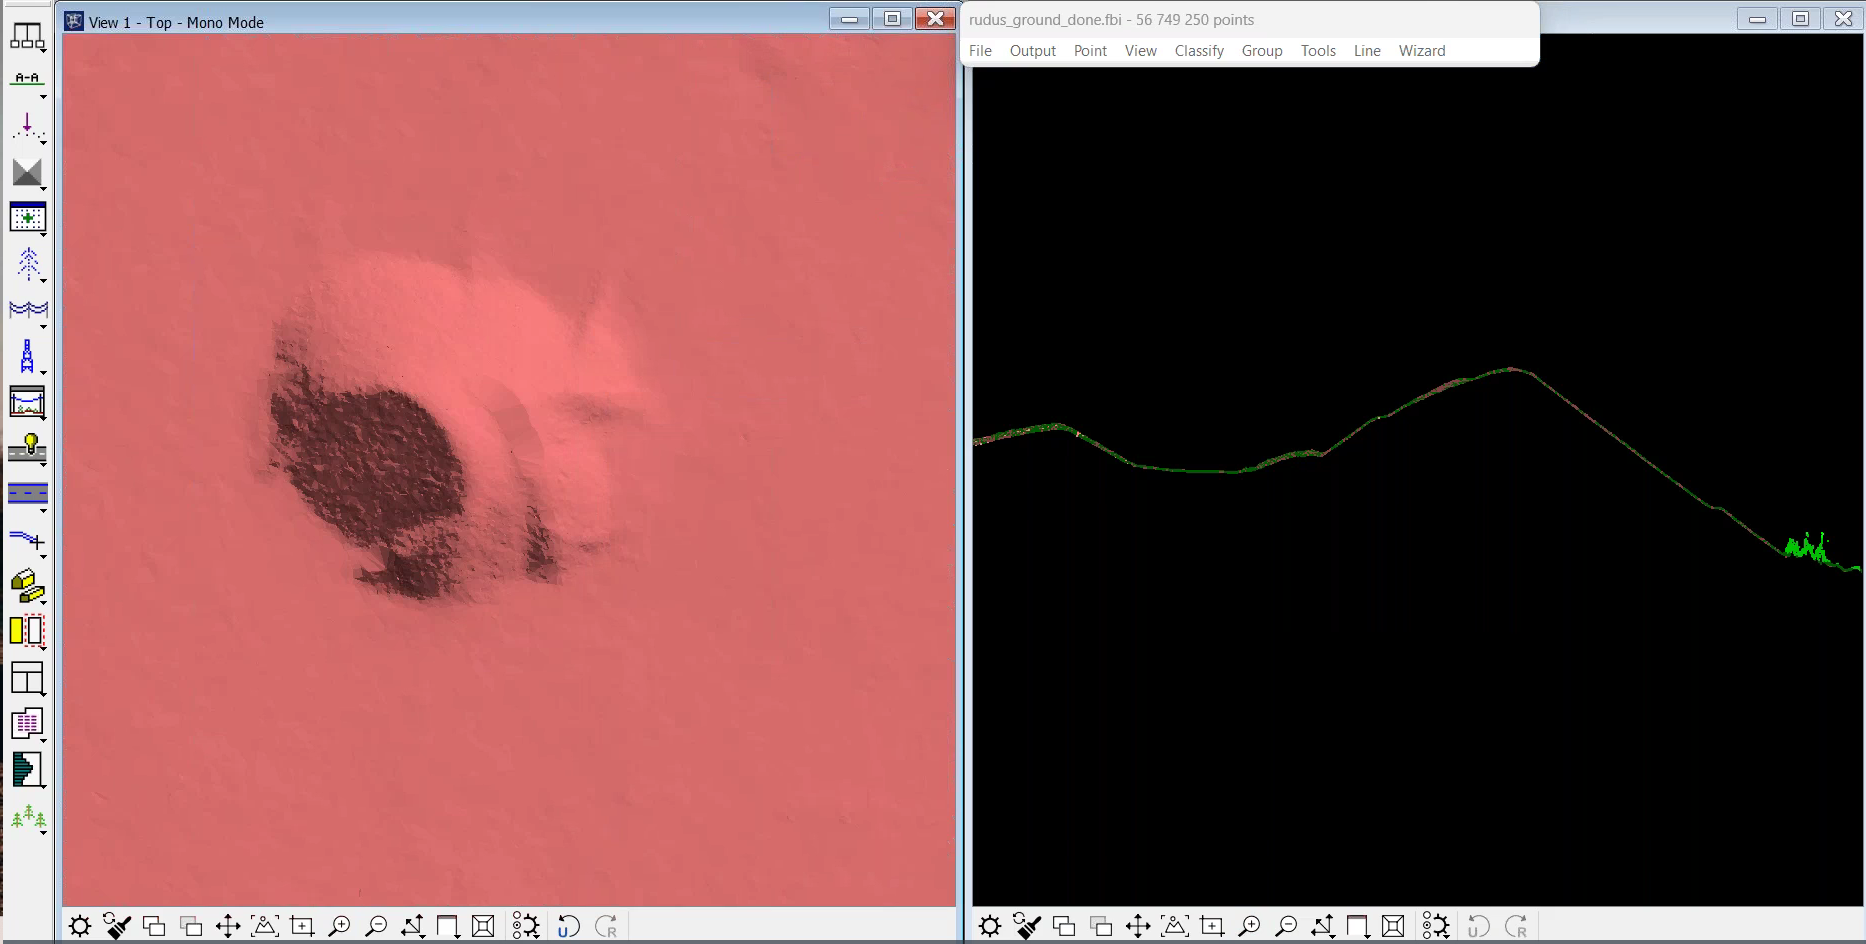
2: Then use Place Polygon to draw a polygon around the stockpile parameter.
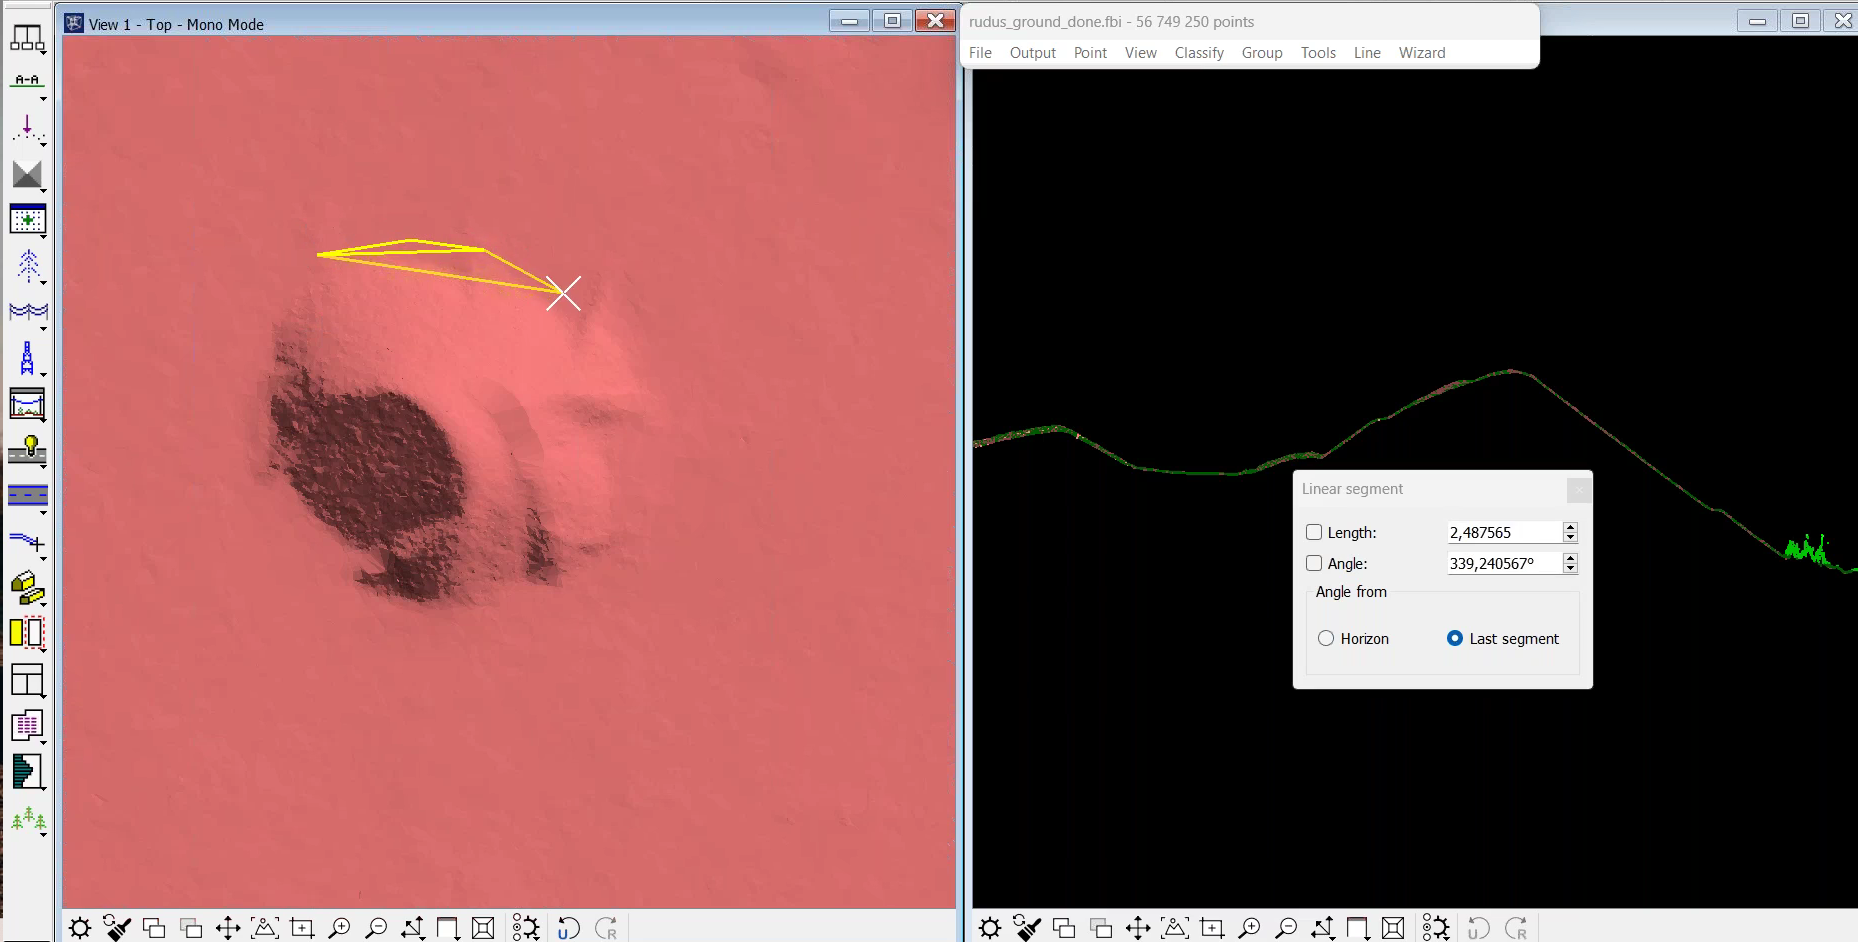
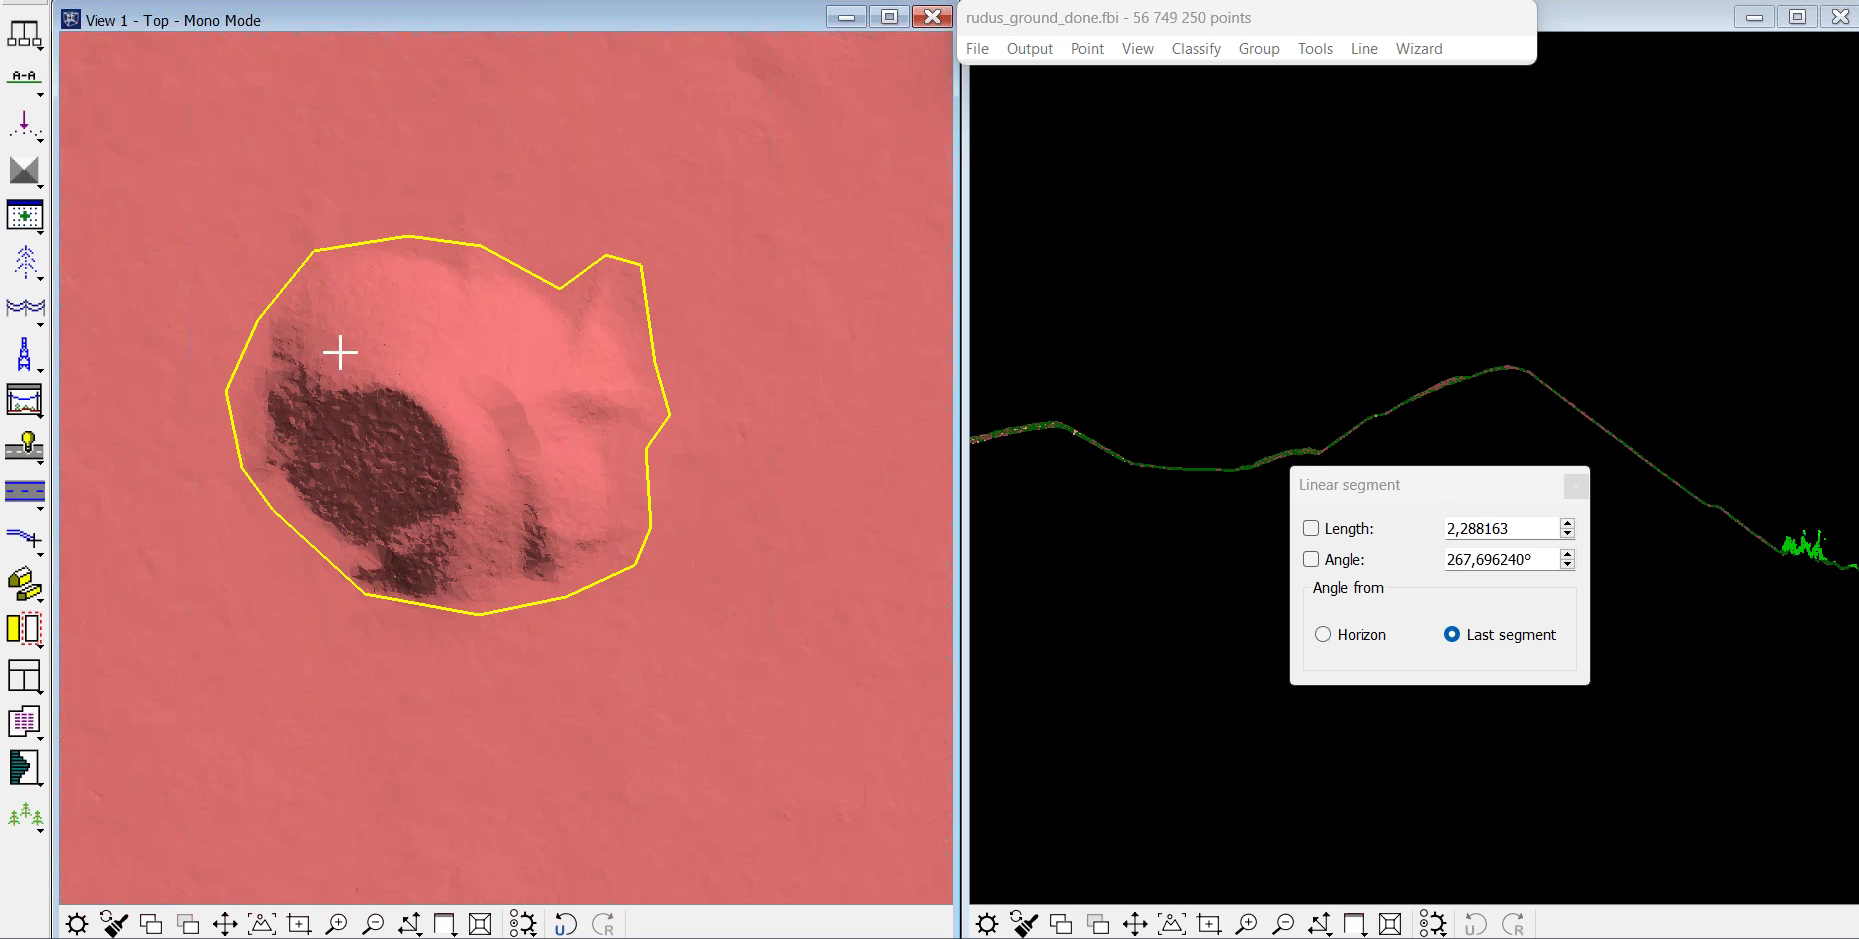
3: Now, select the polygon and go to Compute Stockpile Volume. Choose Display Only to view the computation in a display only mode. And then click the Compute button.
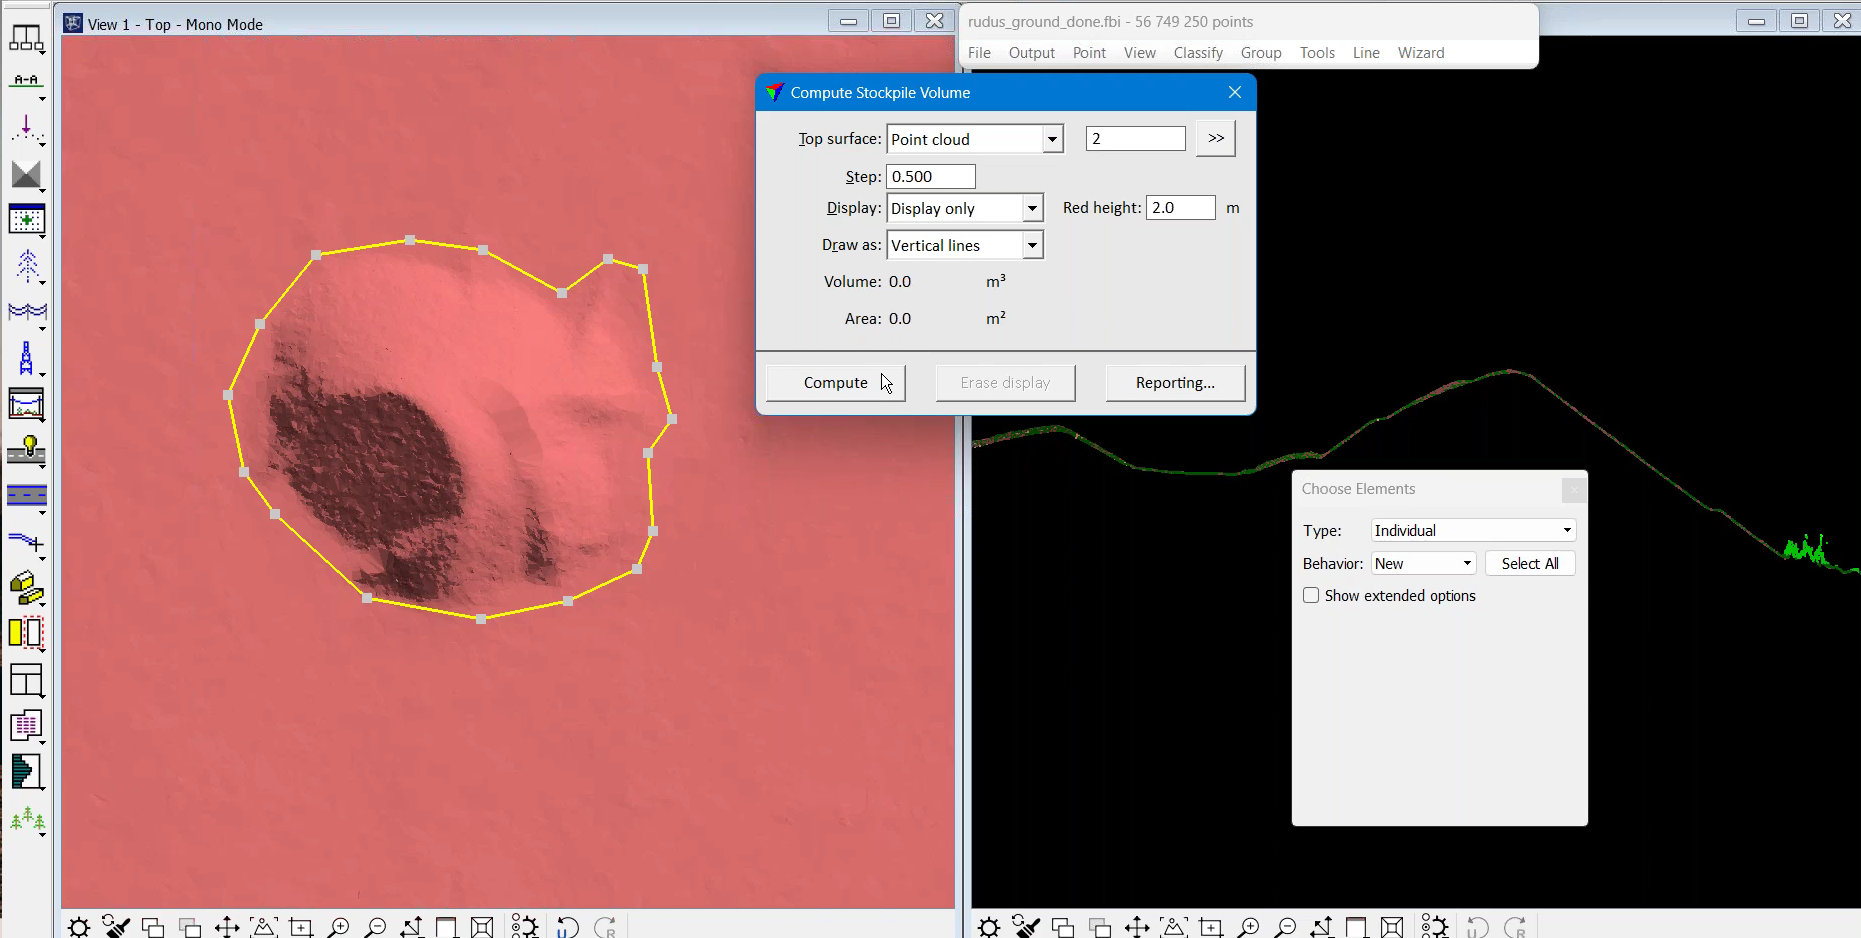
5: This provides the volume, surface area, and maximum height of the selected stockpile.
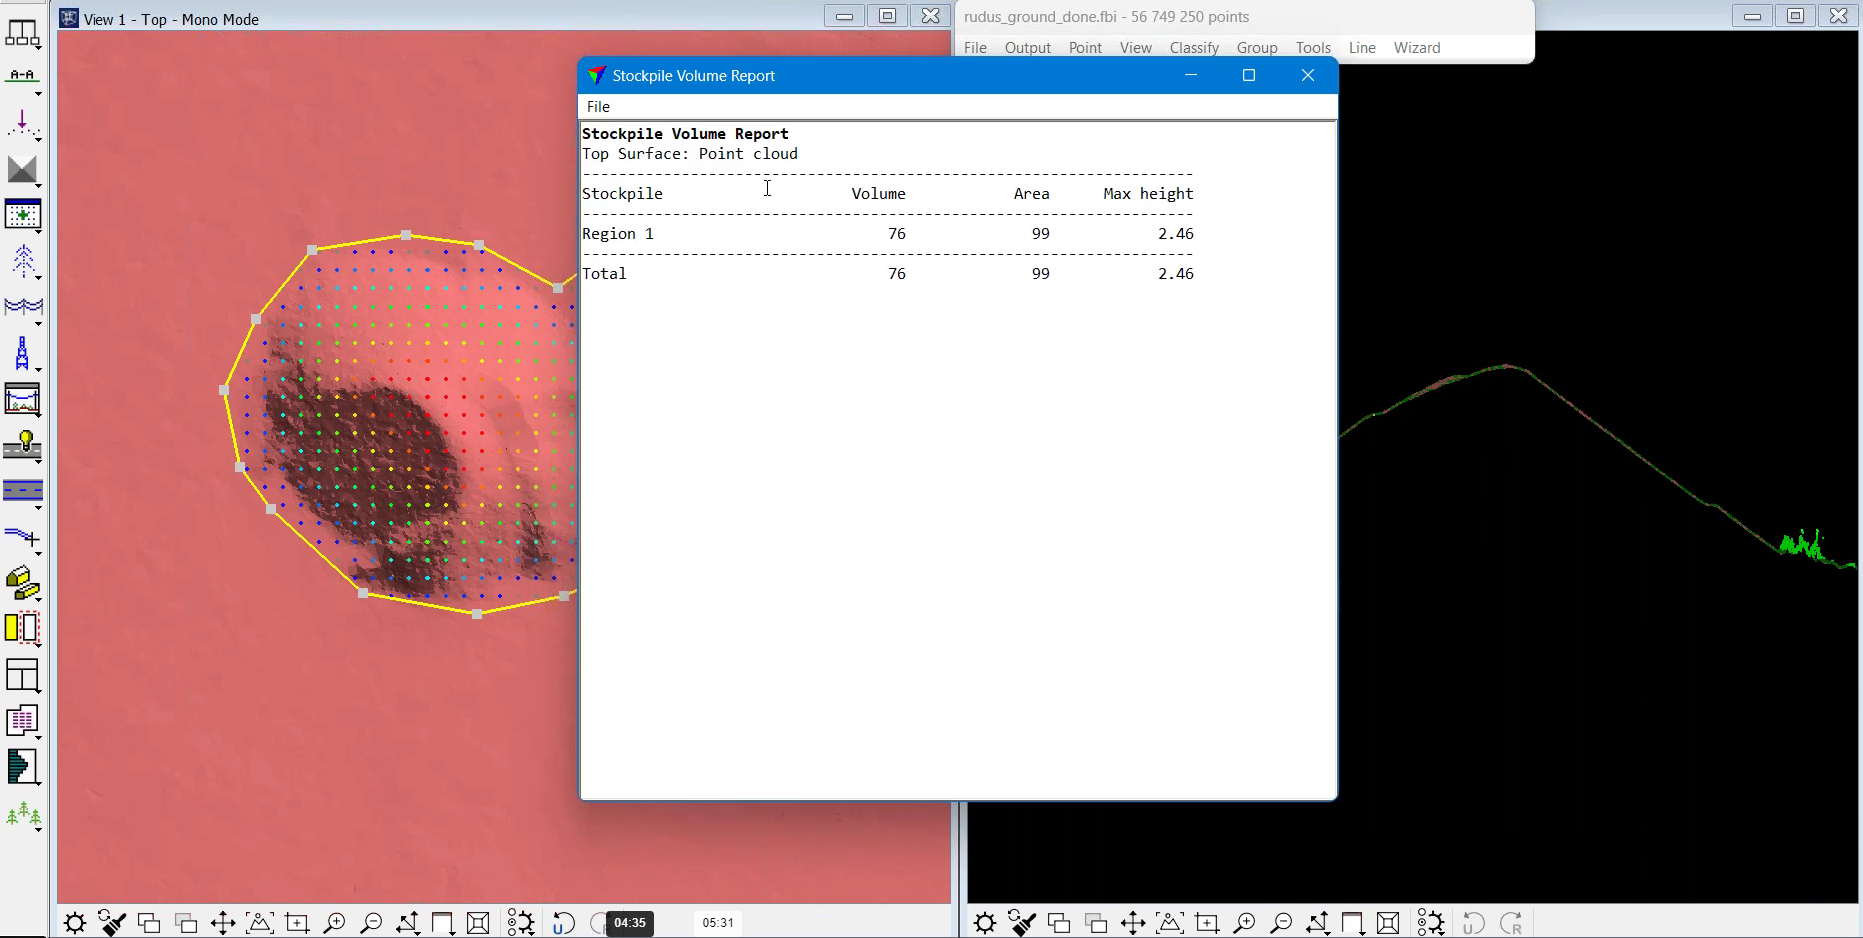
In this example, the software has interpolated a base triangulated model using a draped polygon.
And the following cross-section views show how the profile changes throughout the stockpile.
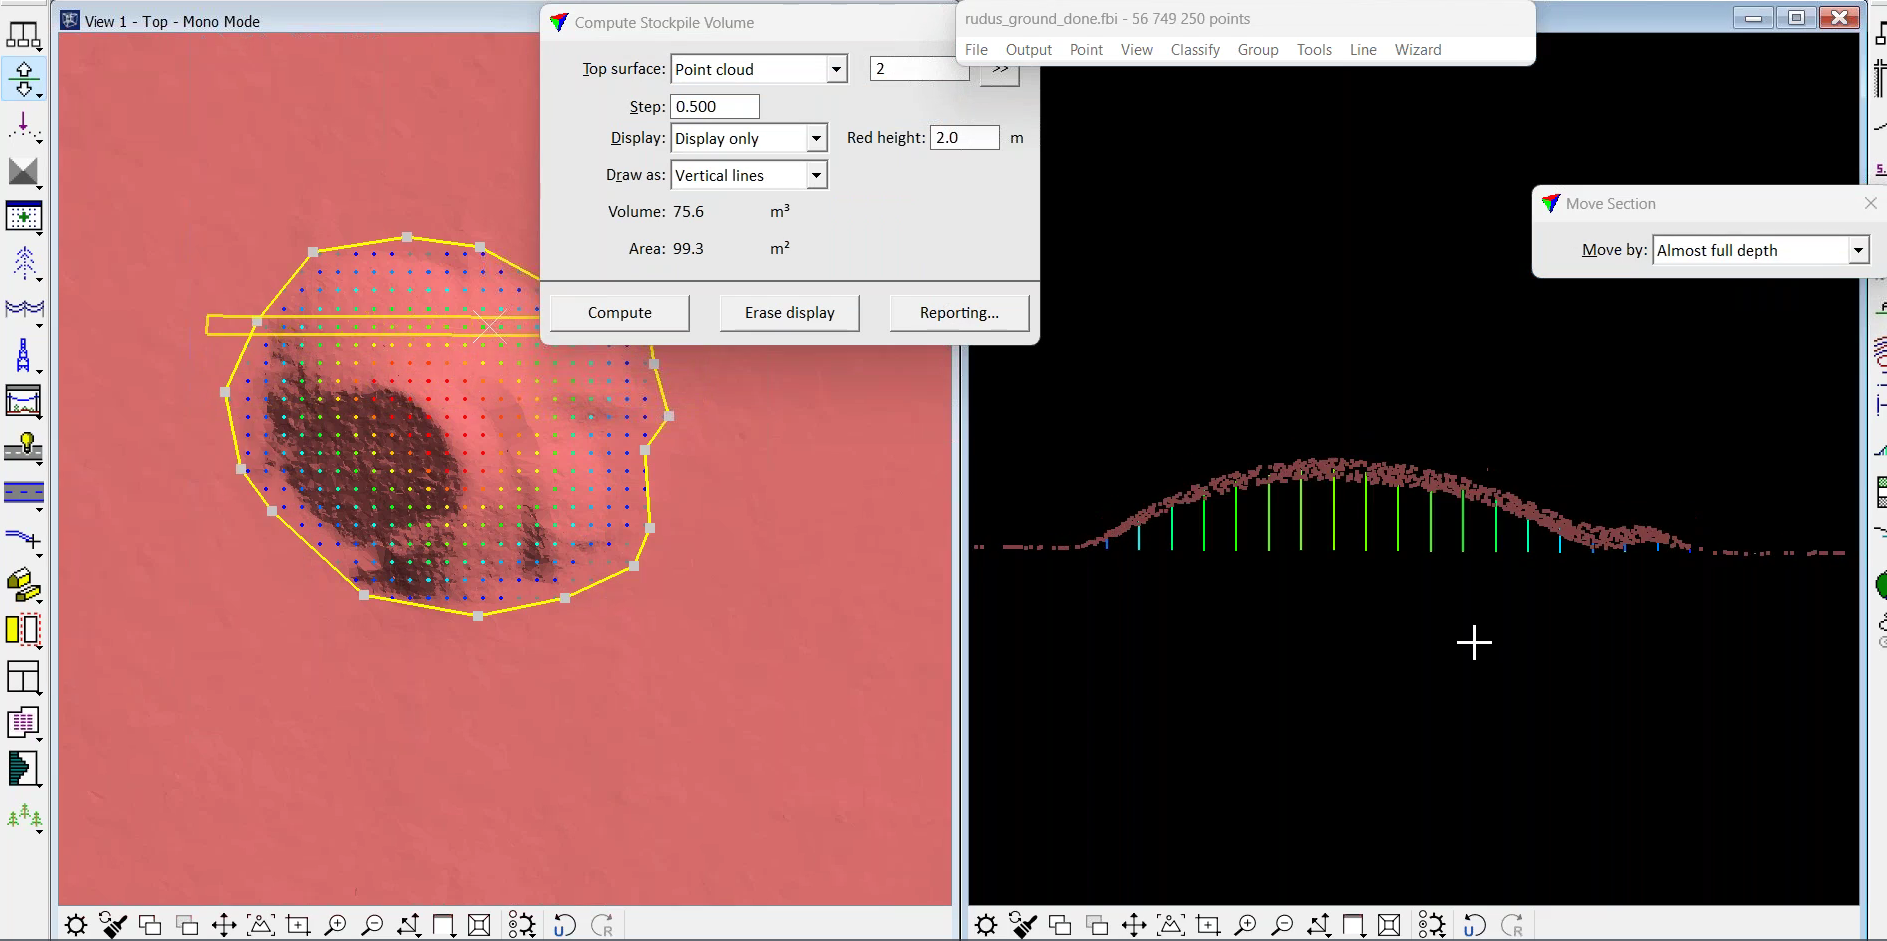
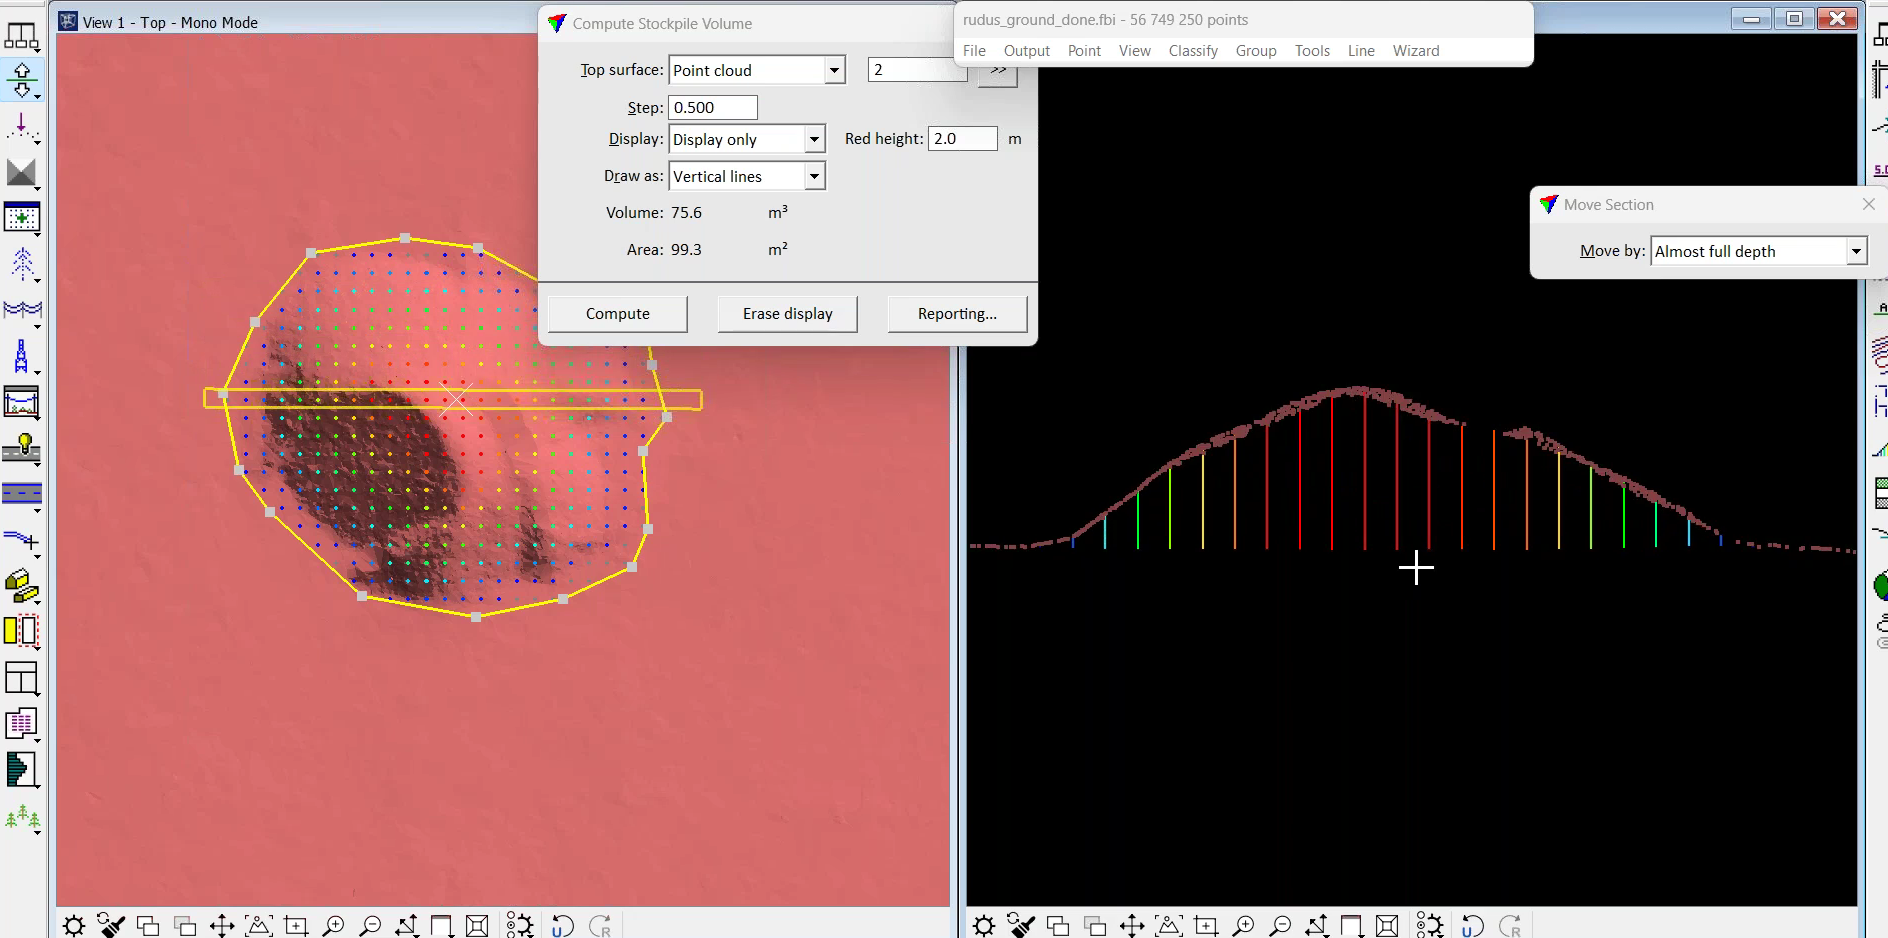
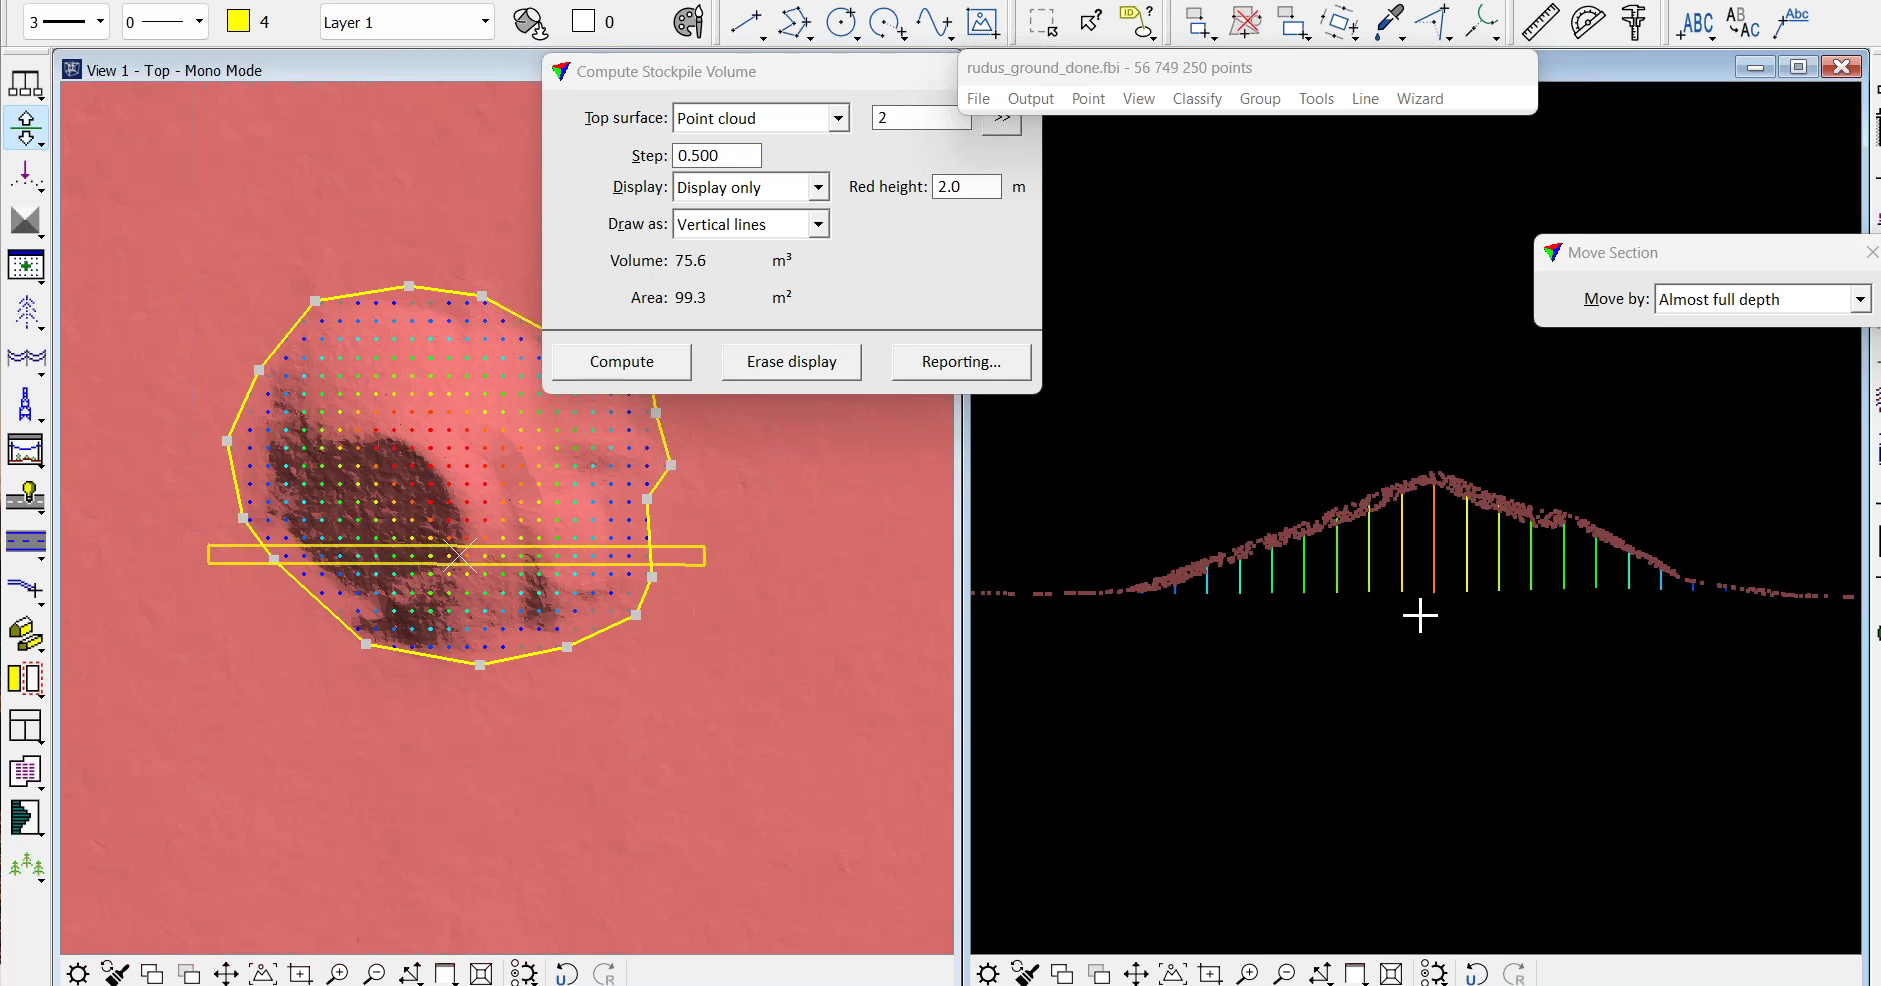
The above example is the simplest method of stockpile computation within the new TerraModeler tool.
Measuring Multiple Stockpiles
The new tool also enables the measurement of multiple stockpiles.
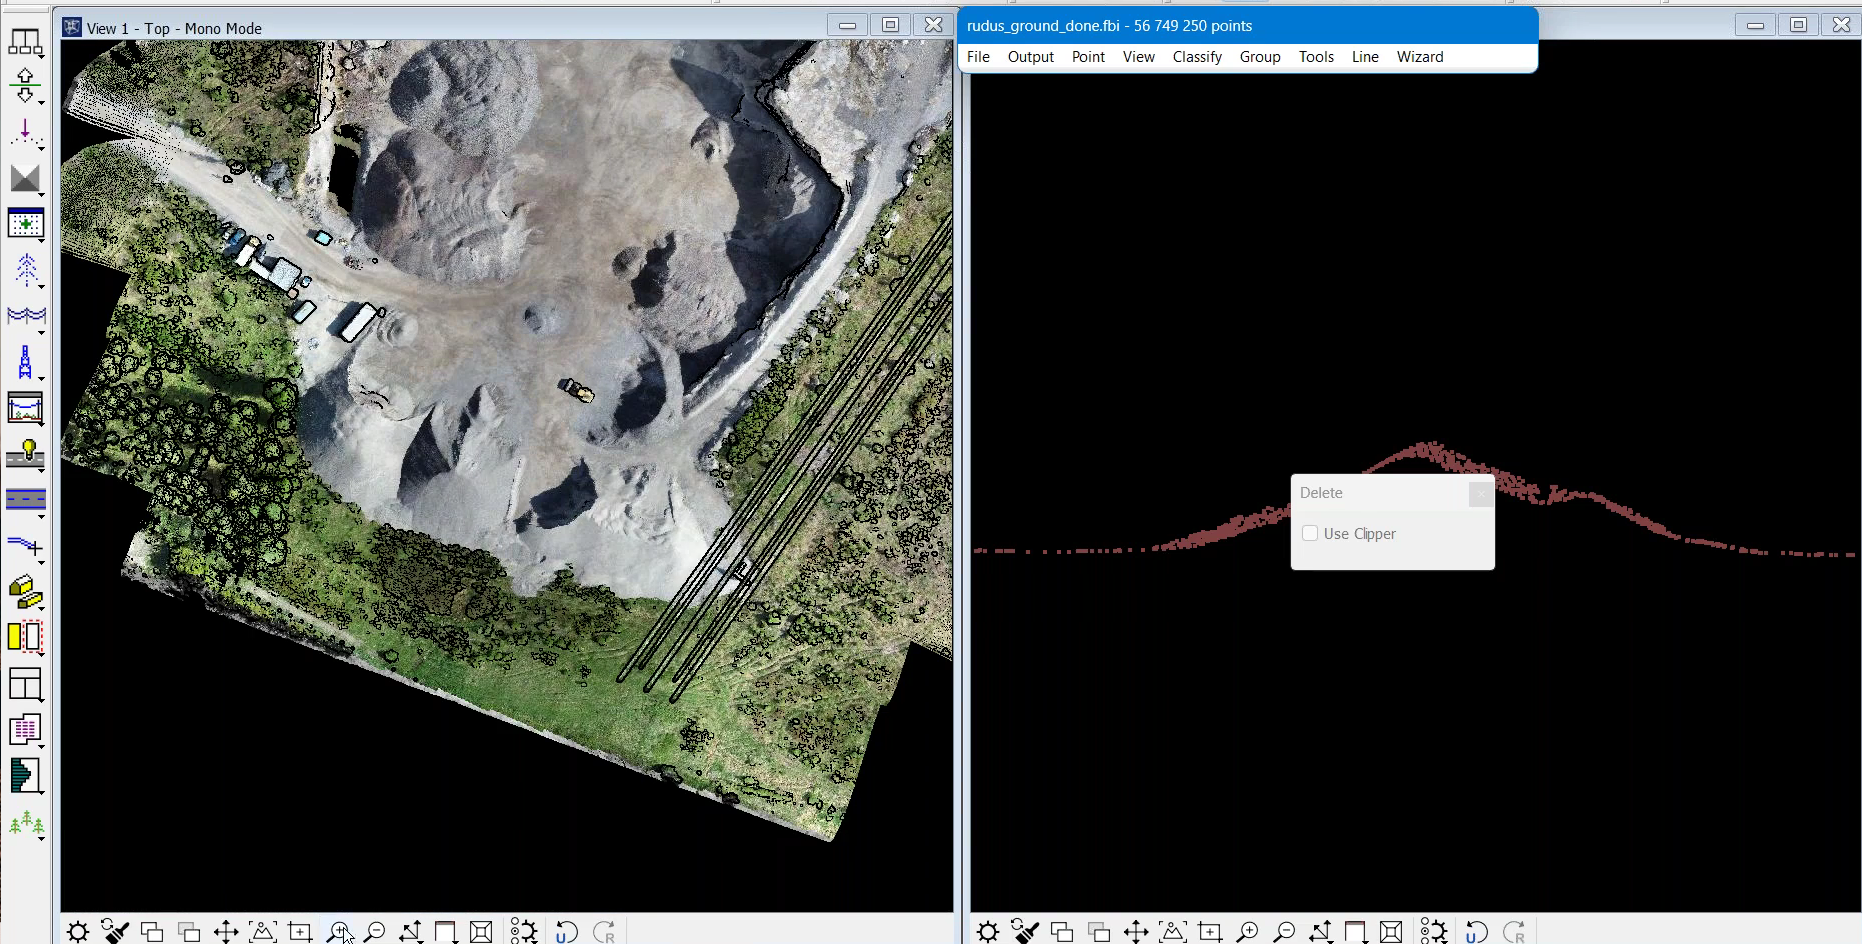
Firstly, draw polygons (manually) around all of the stockpiles.
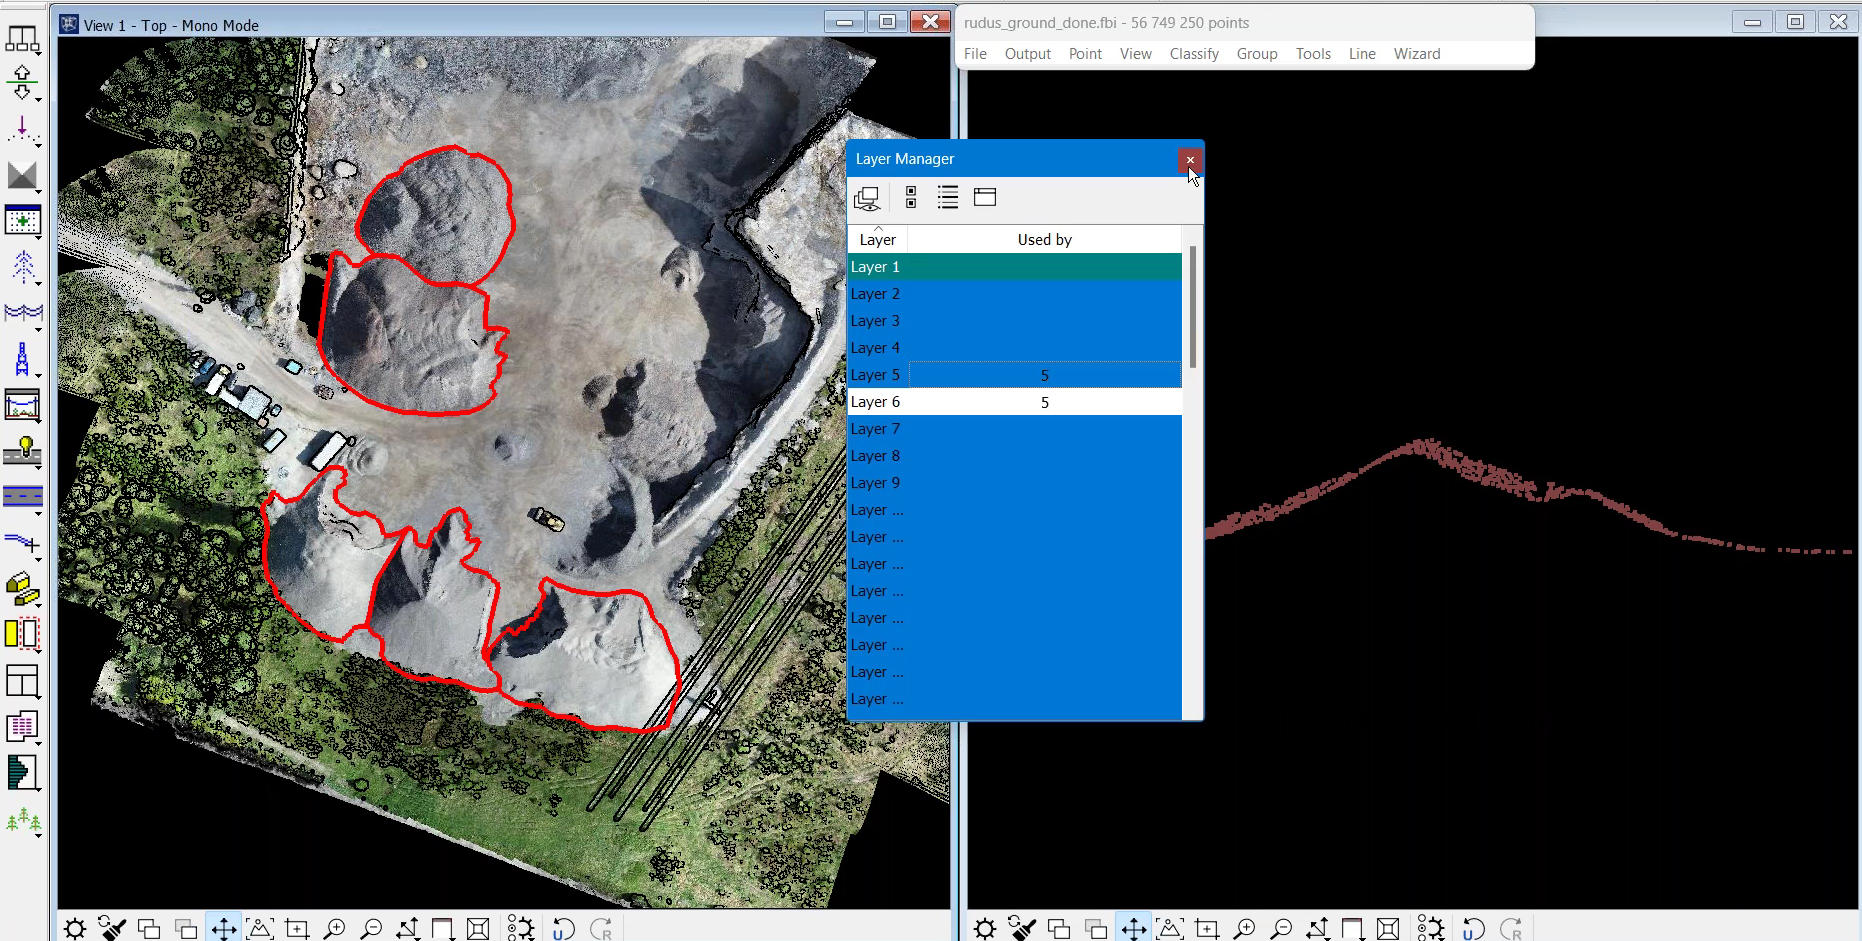
In the event of having multiple stockpiles, it is recommended to create labels or some kind of reference for each stockpile...
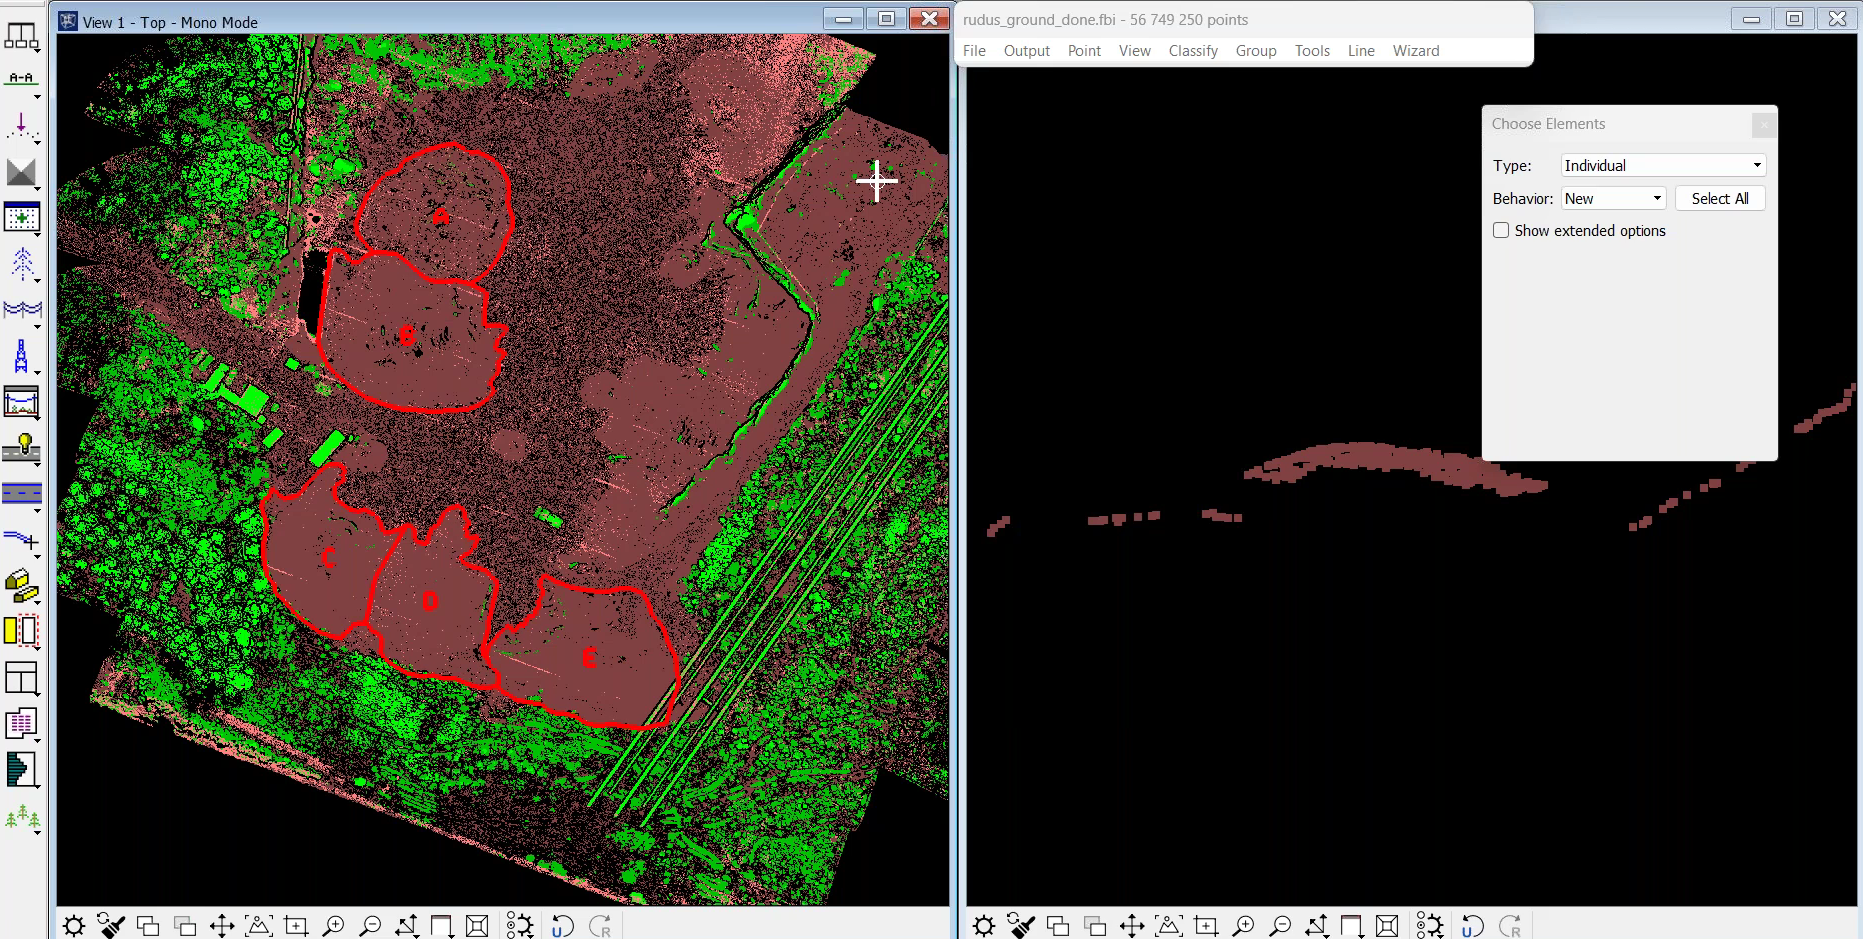
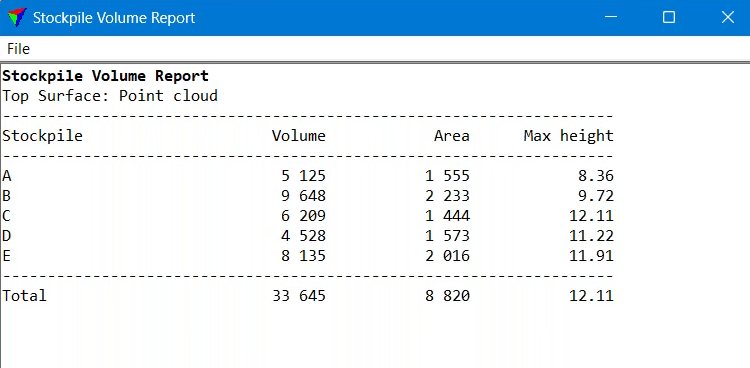
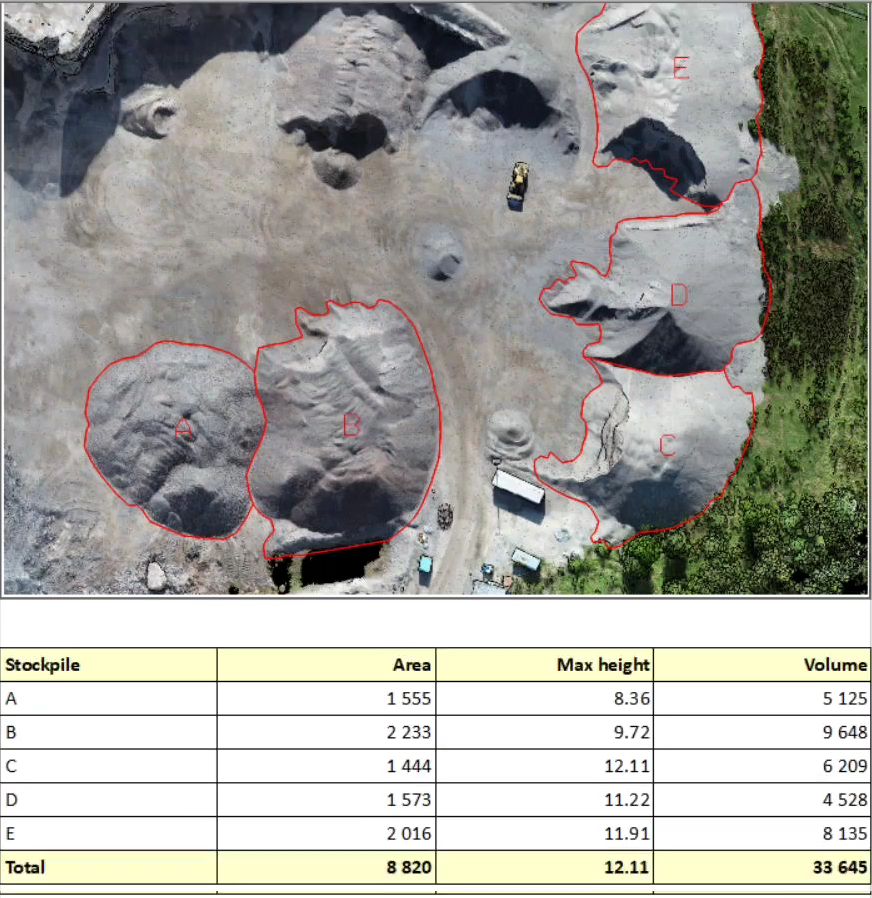
...so that the corresponding data for each stockpile is clear in the subsequent report. In this case, the stockpiles have been tagged from A to E, as the above image, and the report below, show.
Ground Classification To Increase Stockpile Data Accuracy
To ensure the highest accuracy possible, more attention can be given to classifying points within the dataset: In this case, conducting a more robust check of points which should be classified as 'ground'.
Accurately classifying stockpiles as 'ground' is important for generating reliable terrain models, performing accurate volume calculations, analysing obstructions, extracting features, and conducting various data analyse and interpretations.
Because stockpiles often have quite steep slopes, there are parts which do not automatically get classified as 'ground'.
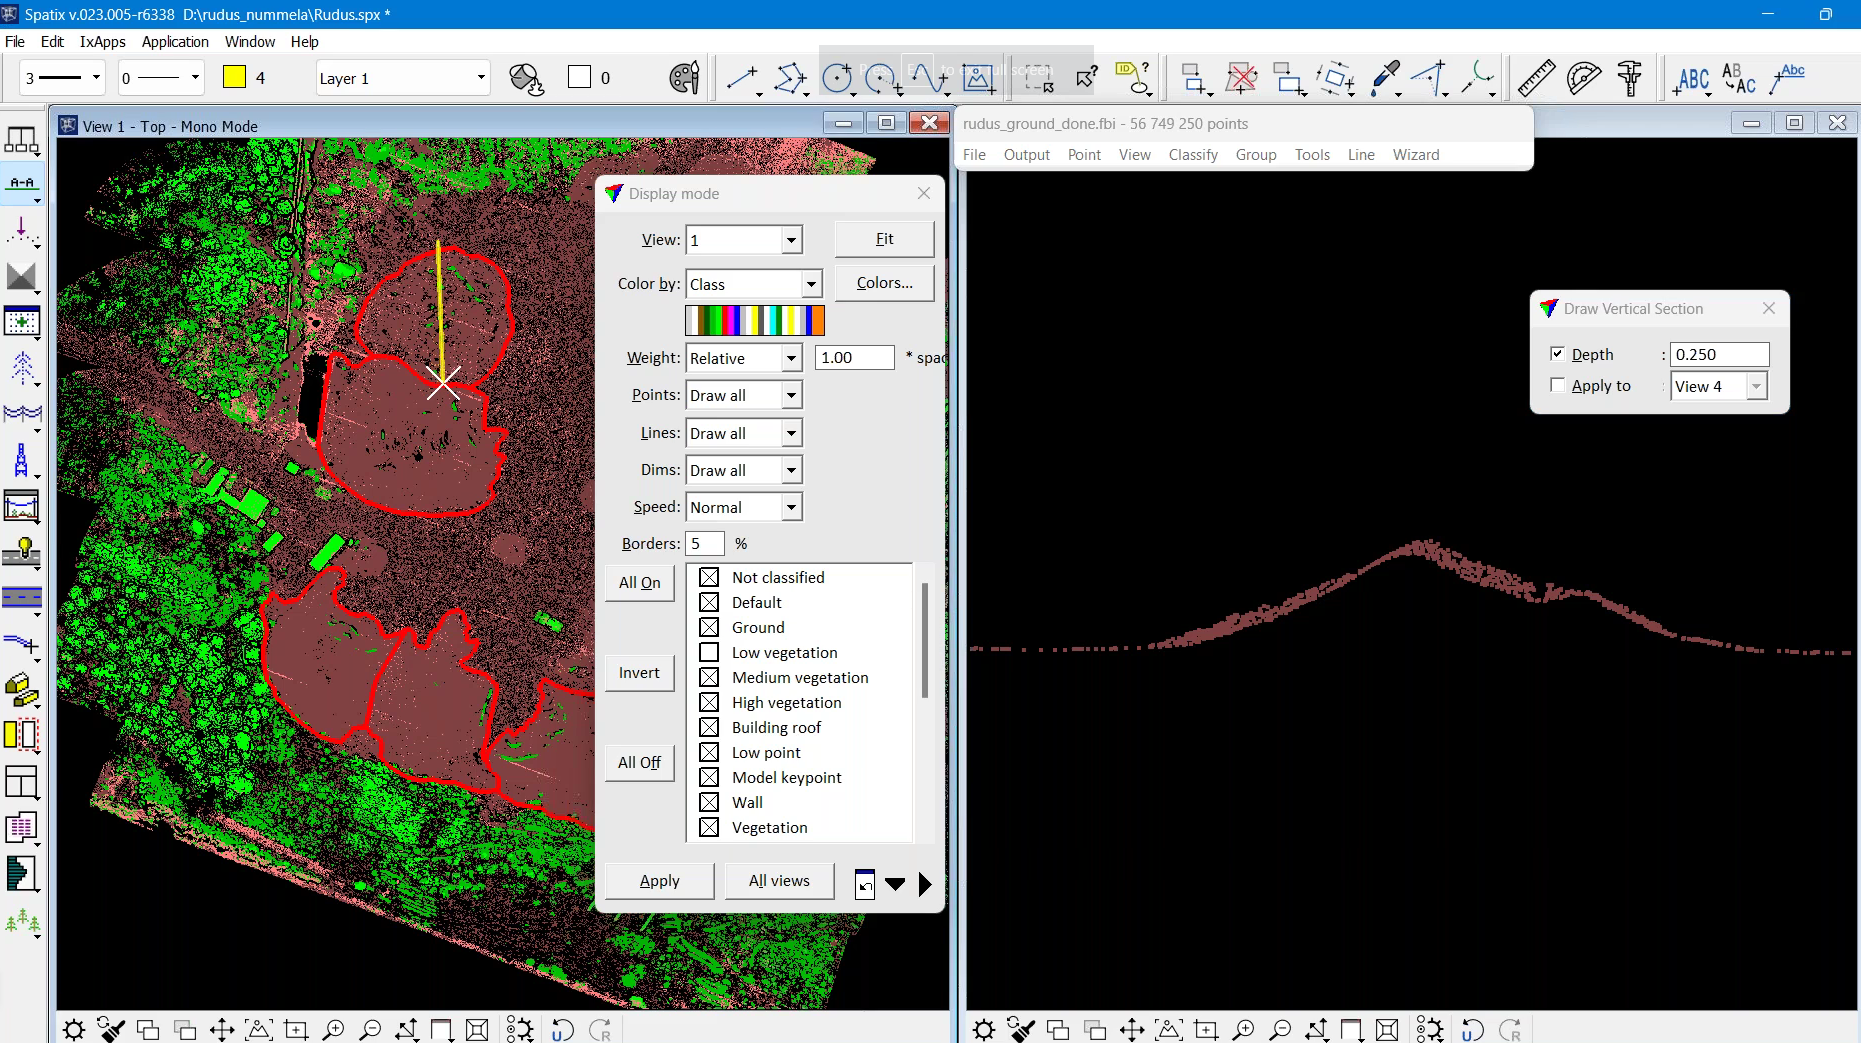
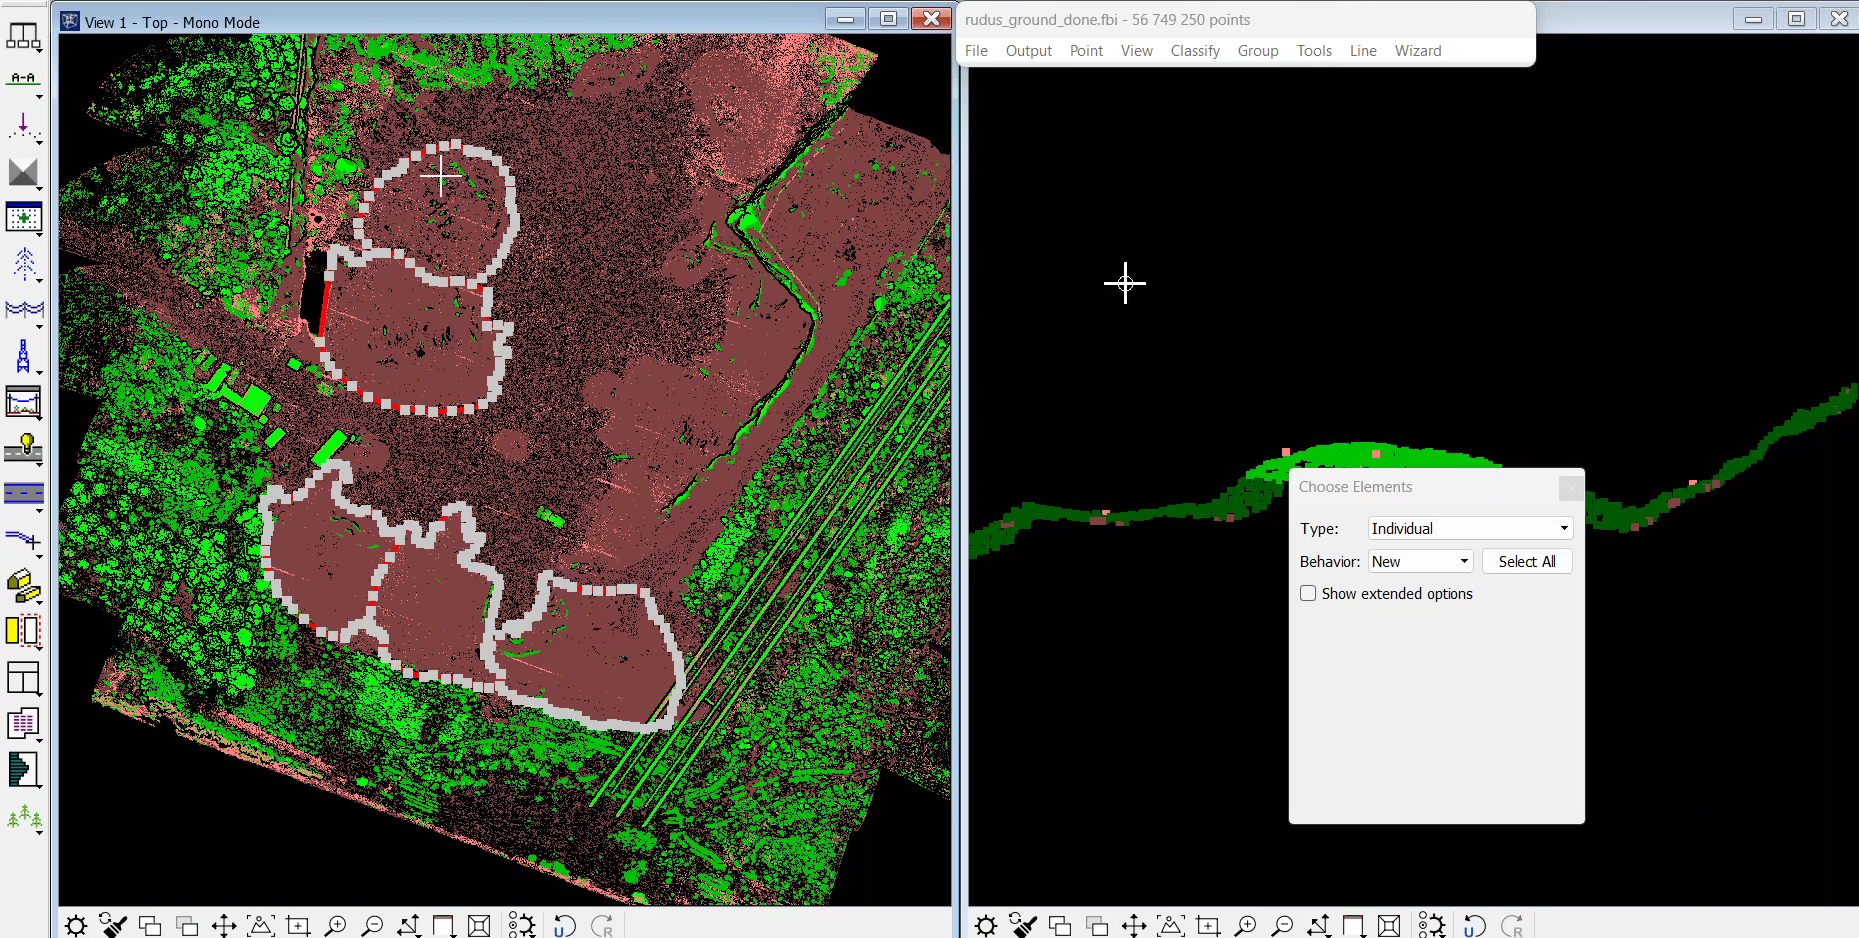
This can be seen in the below image: Notice how the top stockpile in the left panel is mostly coloured brown (ground classification) but has specks of green (vegetation classification) in it - as further demonstrated by the corresponding cross-section in the right panel.
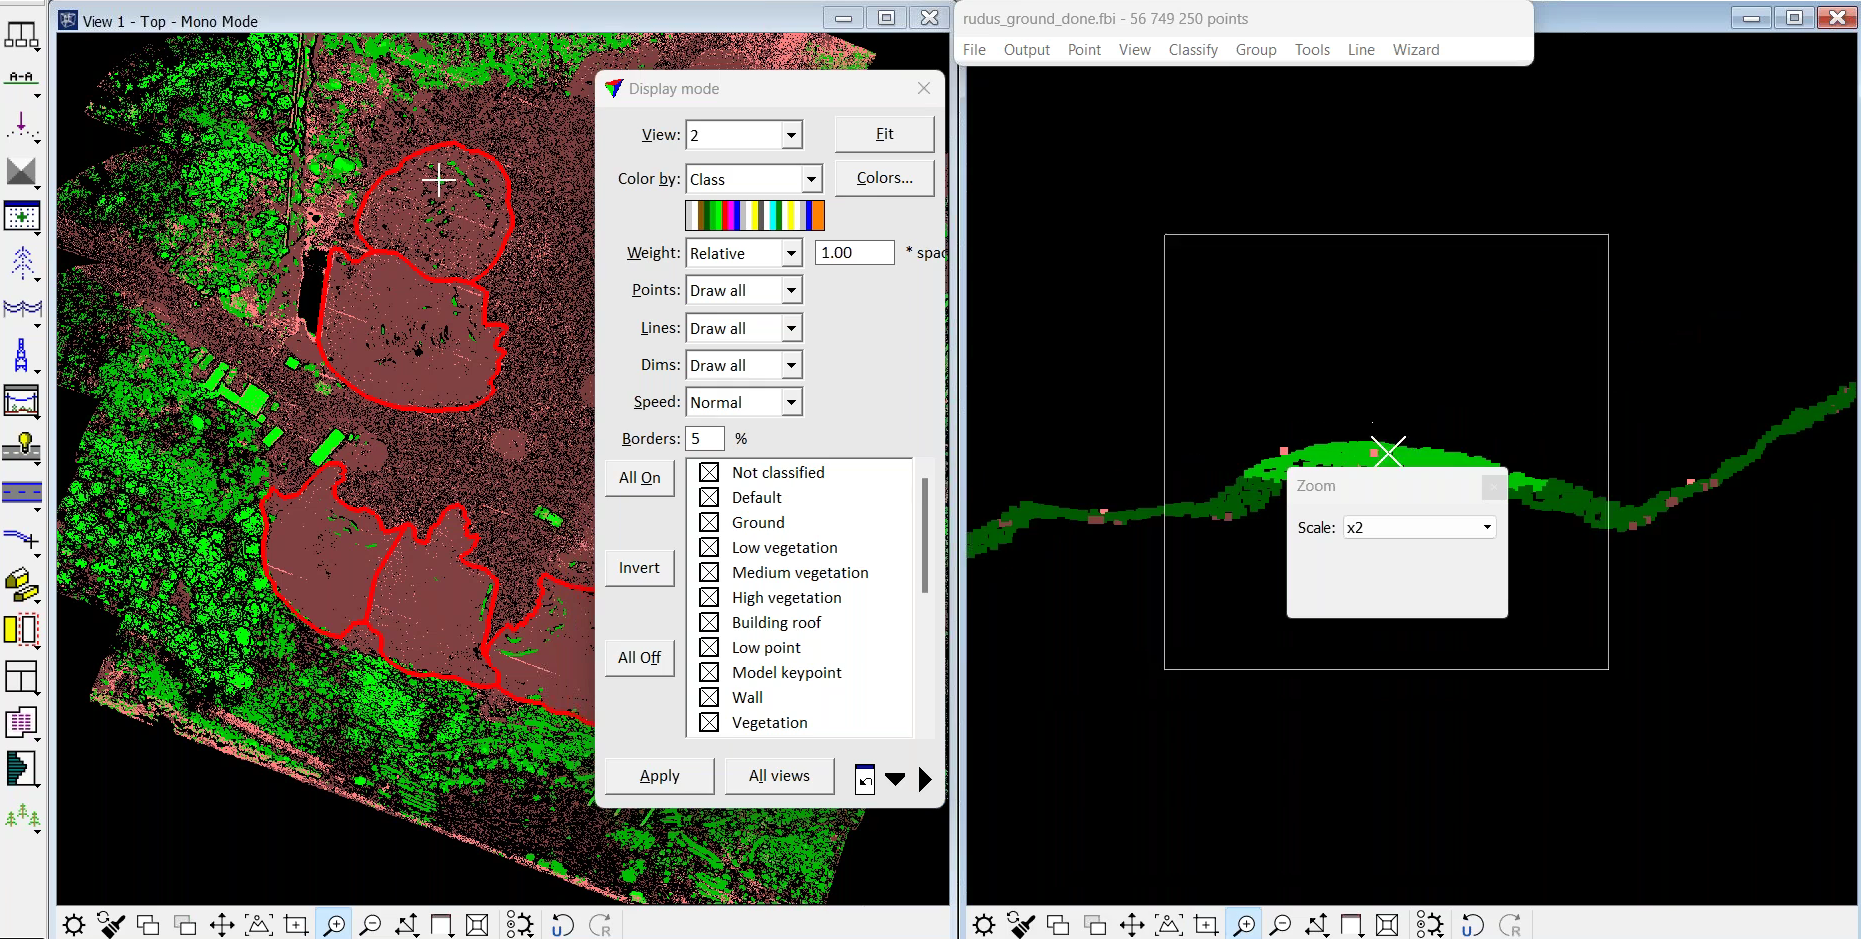
Therefore, some further tweaking is required to obtain more ground classification and ensure that all of the relevant peaks in the stockpile are part of the ground class.
To do this, select the polygons that have been drawn around the relevant stockpiles...
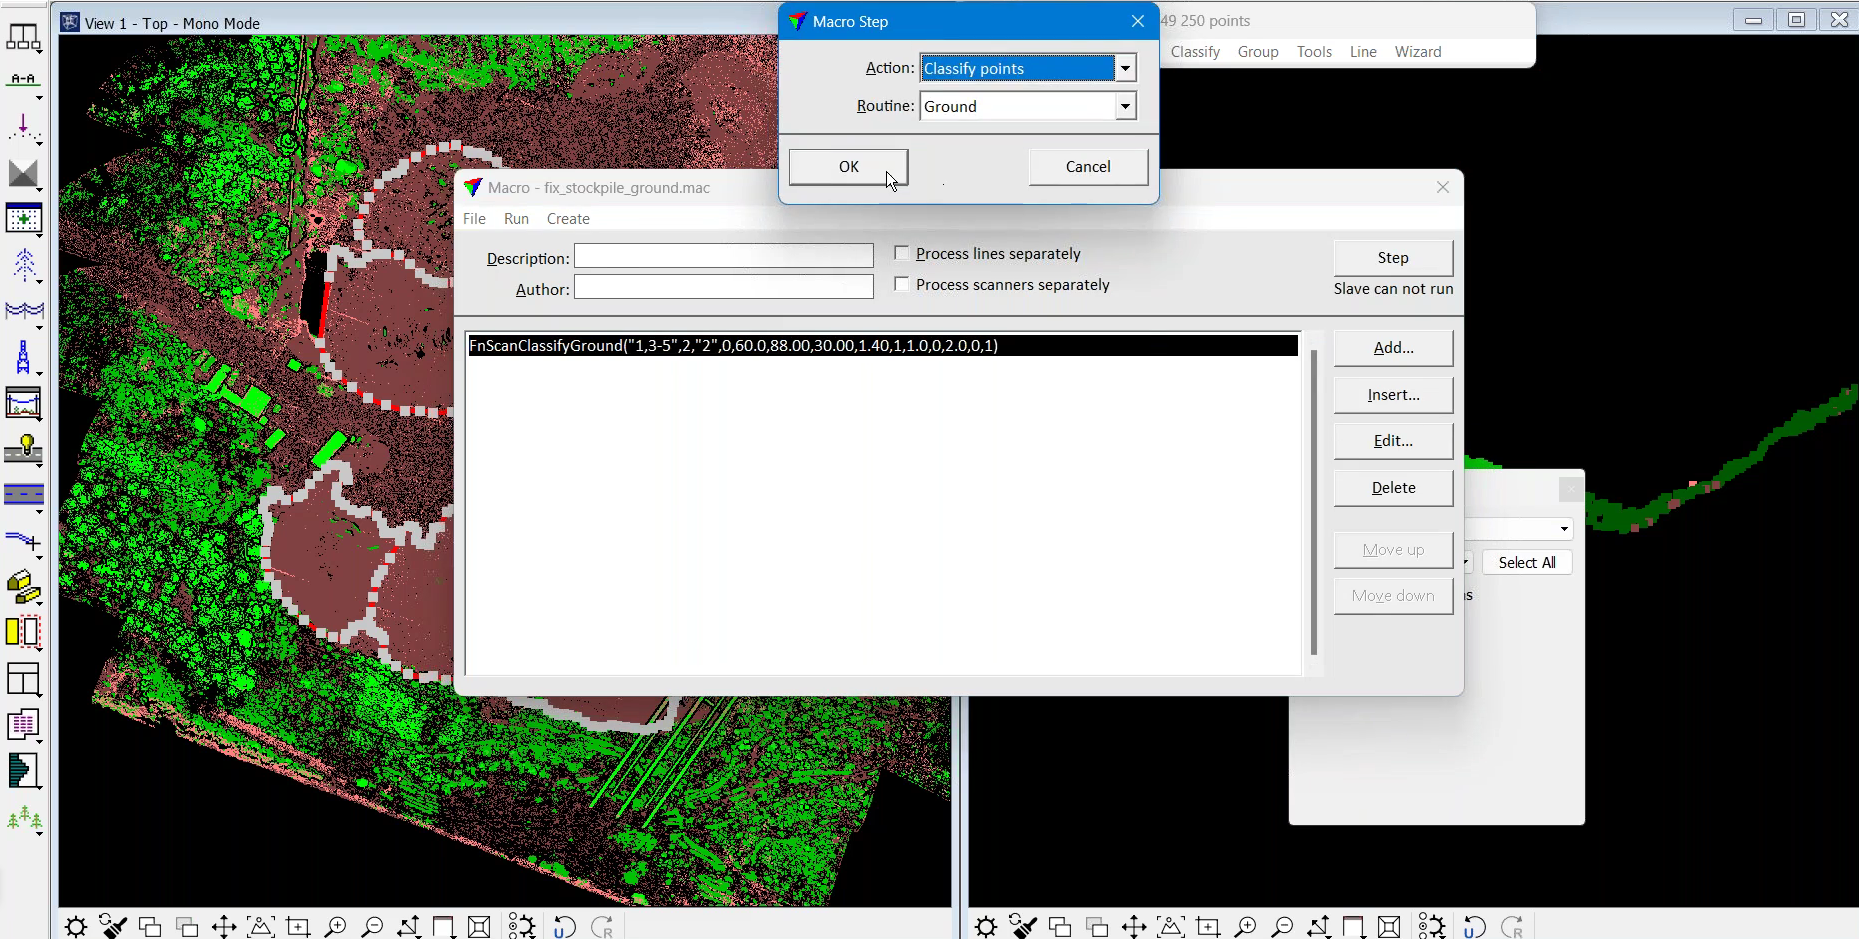
...and run a Macro fix (located in the Tools bar).
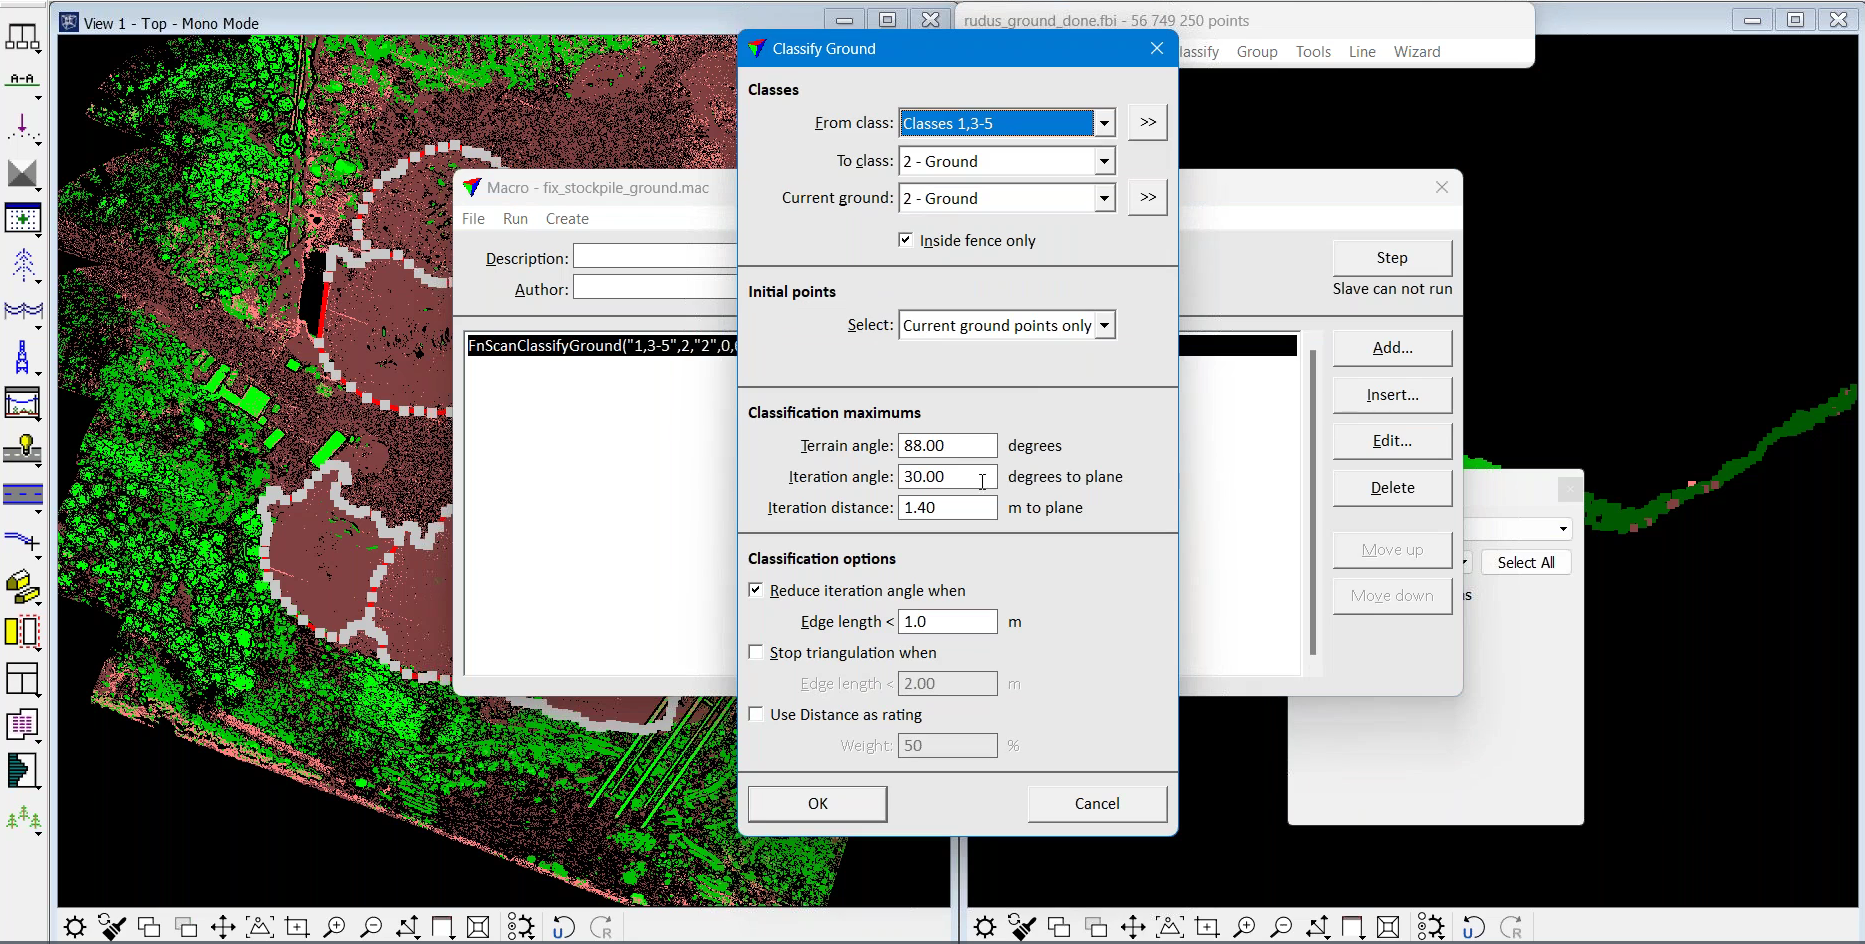
Ensure the 'inside fence only' box is ticked, as this relates to the area within the polygon(s), and add points to the ground by inputting a large iteration angle within the Classification Maximum toolbox, which in this example is 30.00 degrees to plane.
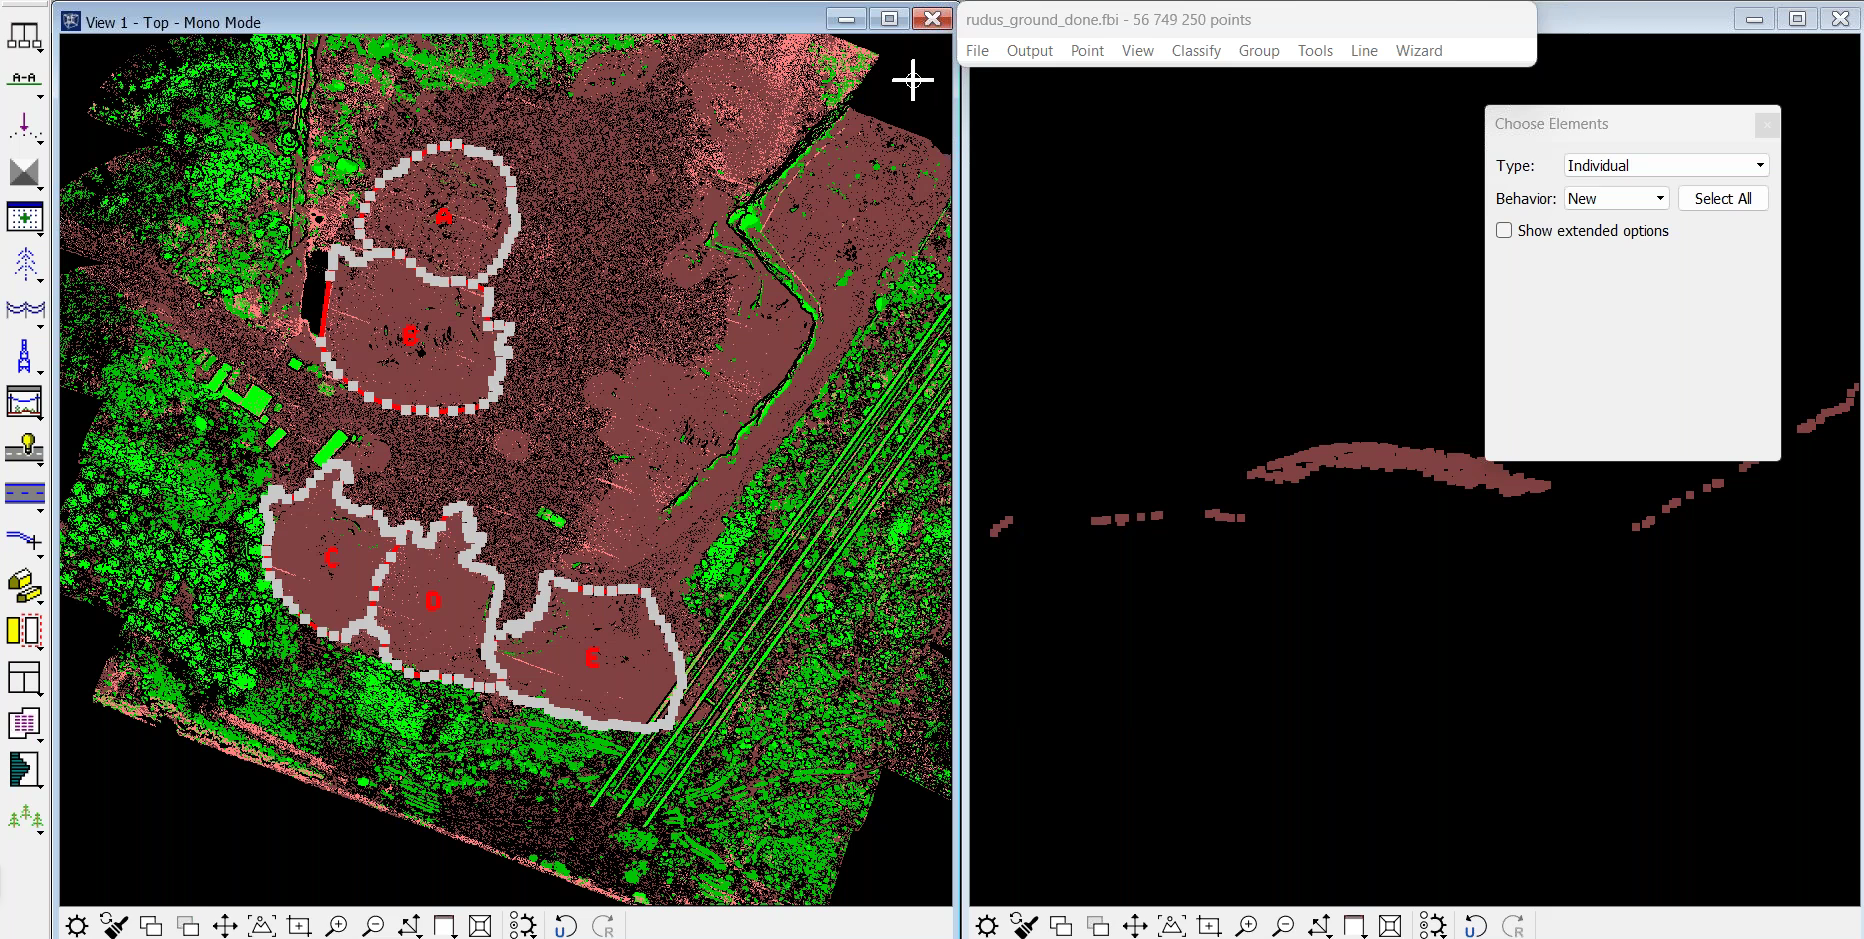
Once this has been completed, the stockpile will be thoroughly classified as ground - as shown by the updated side profile which is now a more consistant shade of brown.
Stockpile Height: Setting
TerraModeler enables users to set a specific threshold for the height of a stockpile - showing a red zone when parts of a stockpile exceed the customised height parameter.
Setting a maximum height for stockpiles can be useful for numerous reasons, including:
Safety and Stability: Stockpiles that exceed a certain height may pose safety risks. By flagging up when a stockpile exceeds the maximum height, it allows for proactive monitoring and necessary precautions to ensure the safety and stability of the stockpile.
Compliance and Regulations: Setting a maximum height in volumetrics software helps ensure that stockpiles remain within the permitted limits, enabling companies to meet regulatory requirements and avoid potential fines or penalties.
Planning and Inventory Management: Flagging when a stockpile exceeds the specified height prompts necessary actions such as redistribution, removal, or adjustment of the stockpile, facilitating efficient material and inventory management and redistribution planning.
In the below example, the red height has been set at 10 metres - ie, any part of the stockpile that exceeds 10m will be displayed as red in the dataset.
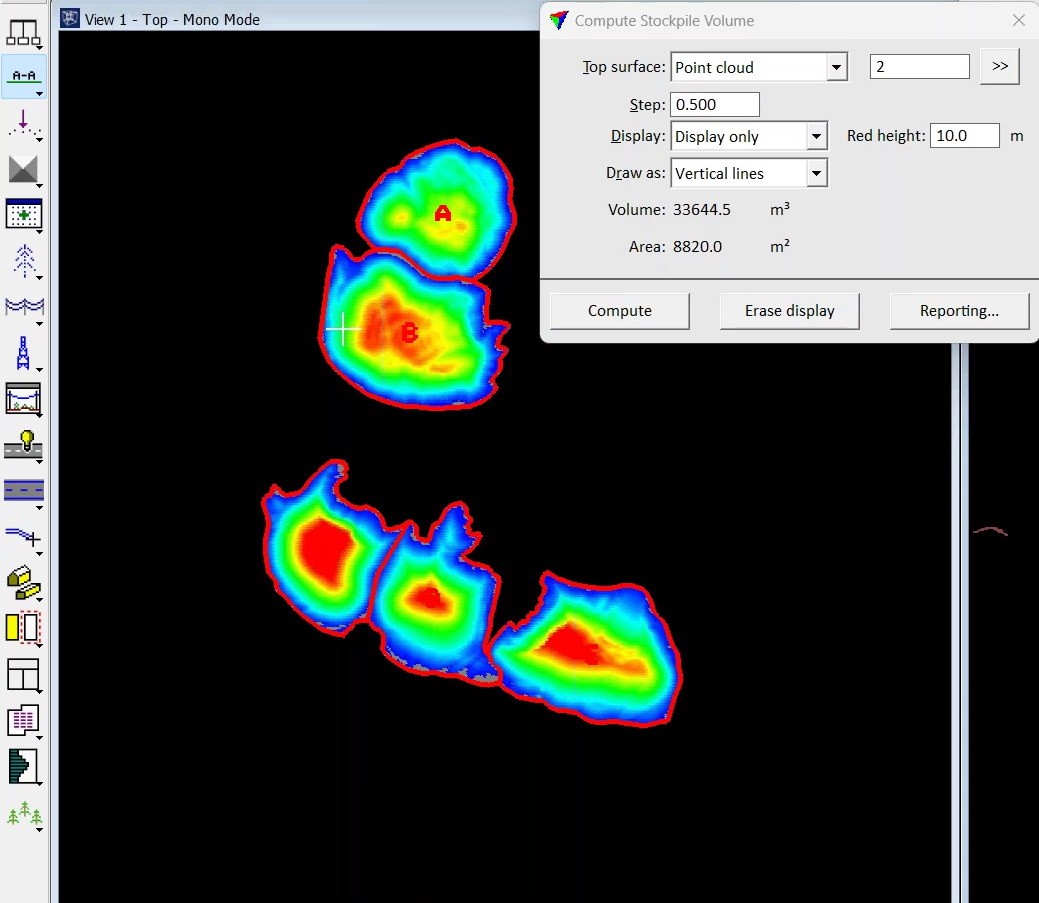
Using the above example, stockpiles C, D, and E - ie the three stockpiles located to the bottom of the dataset - show patches of red, highlighting areas which are above 10m.
In contrast, stockpiles A and B are under 10m in height, and so do not have the same deep shade of red - as illustrated in the graphic below, including the cross-section view of stockpile A.
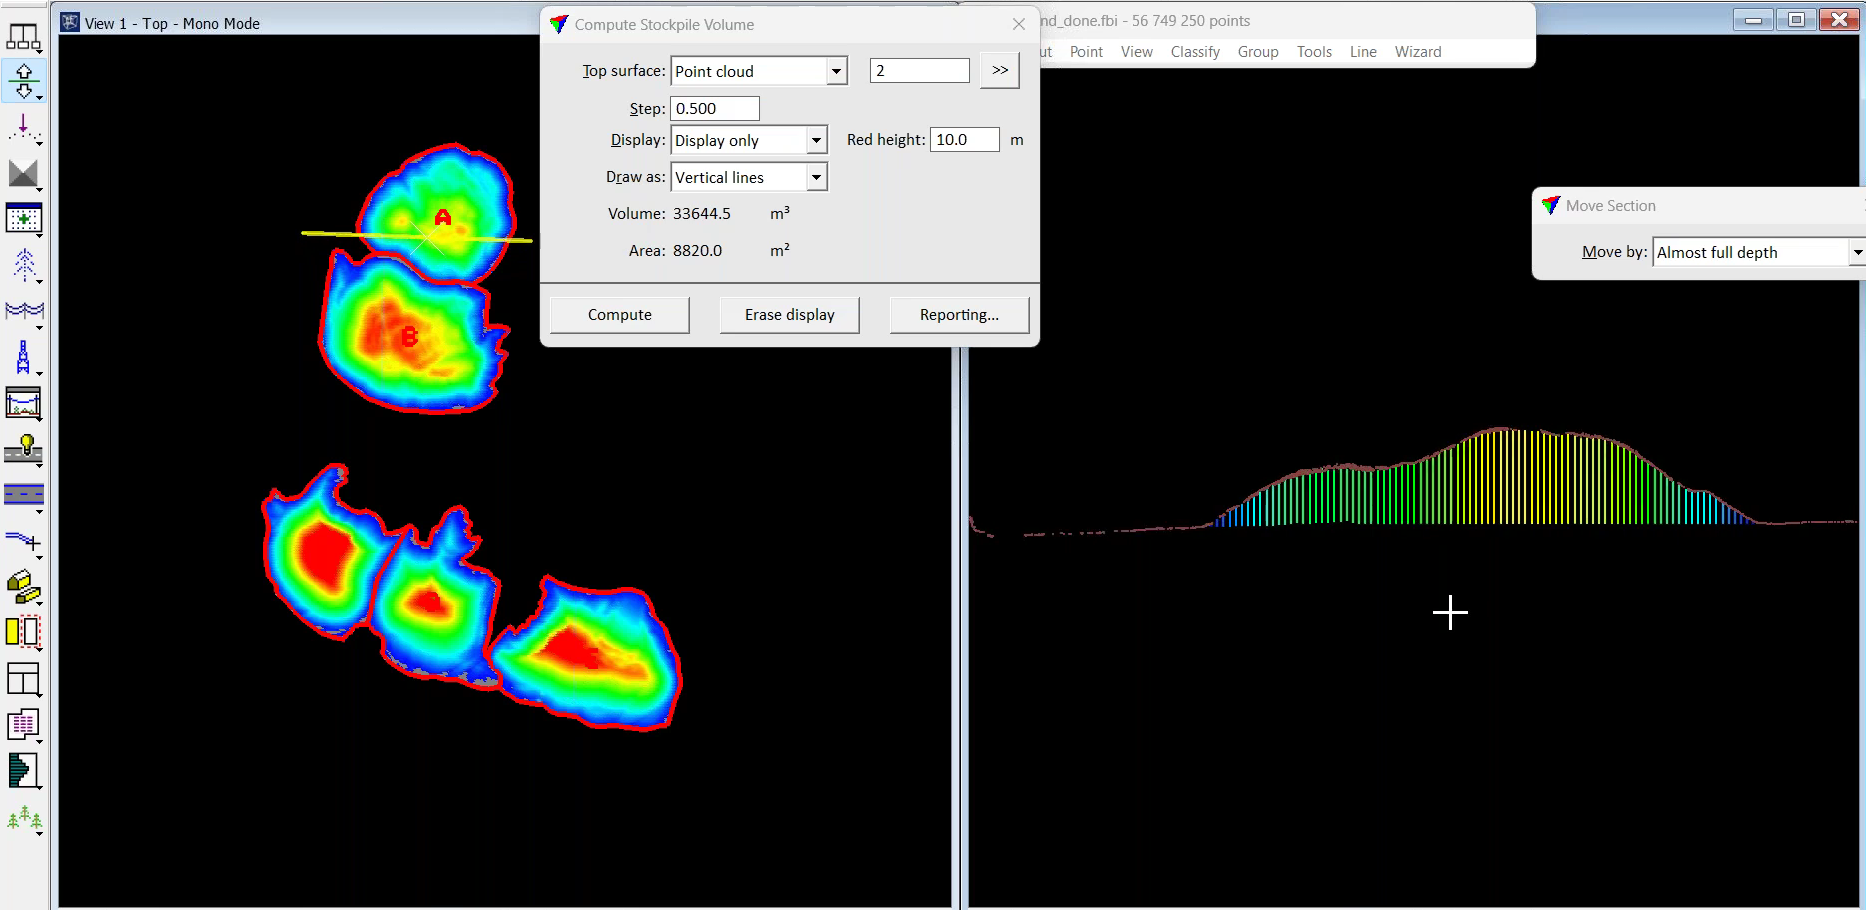
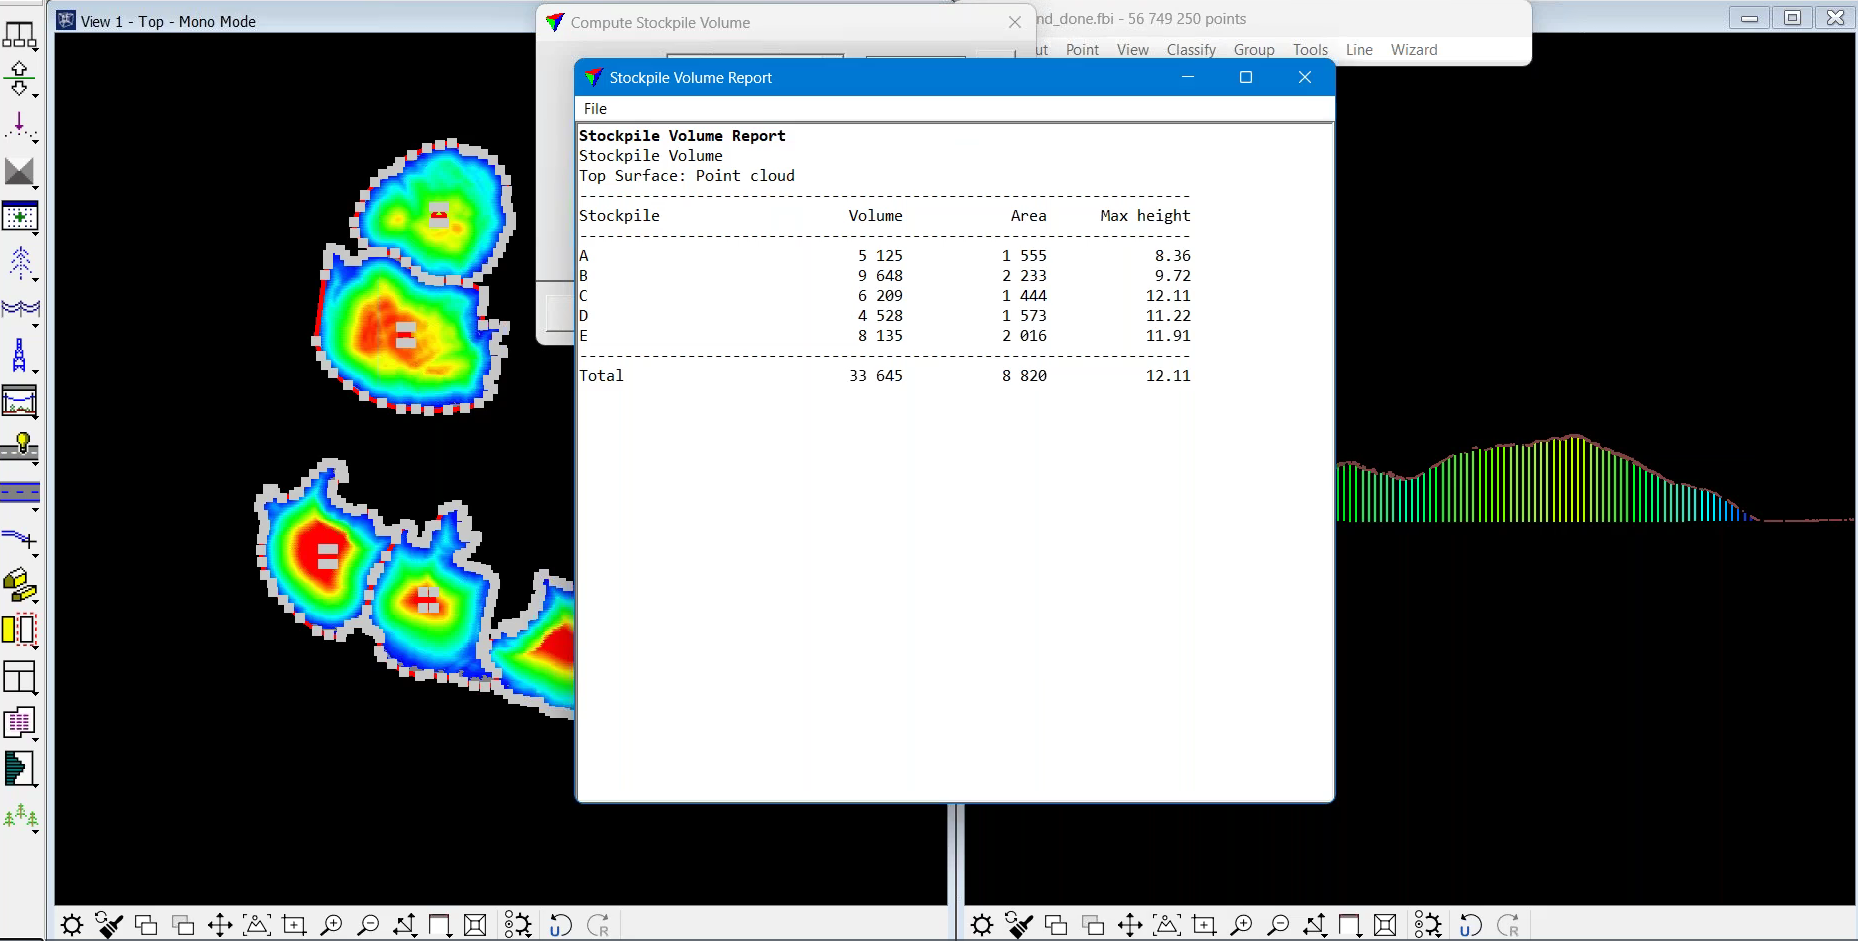
This visual information correlates with the maximum heights of each stockpile, which is shown in the table below.
Stockpile | Volume | Area | Max Height |
A | 5 125 | 1 555 | 8.36 |
B | 9 648 | 2 233 | 9.72 |
C | 6 209 | 1 444 | 12.11 |
D | 4 528 | 1 573 | 11.22 |
E | 8 135 | 2 016 | 11.91 |
Total | 33 645 | 8 820 | 12.11 |
Automated Stockpile Report Generation
TerraModeler provides the option to create a professional-looking stockpile report.
It provides functionality to conduct automatic result generation to avoid the need to manually type in the numerical values of the volumes/heights of stockpiles. This streamlines the process and prevents mistakes being made by manual typing errors.
This can be done by using utility software, such as Sobelsoft OpenOffice Writer Find and Replace, which can then be deployed to auto-replace variables, such as #A_AREA, with the corresponding numerical values.
For instance, enter variables such as these...
Stockpile | Area | Max Height | Volume |
A | #A_AREA | #A_MAXHGT | #A_VOLUME |
B | #B_AREA | #B_MAXHGT | #B_VOLUME |
C | #C_AREA | #C_MAXHGT | #C_VOLUME |
Total | #TOTAL_AREA | #TOTAL_MAXHGT | #TOTAL_VOLUME |
...and then the utility software can be used to automatically populate the report with actual numbers.
Stockpile | Area | Max Height | Volume |
A | 2 524 | 3.98 | 4 976 |
B | 2 709 | 3.85 | 4 642 |
C | 3 158 | 3.85 | 4 955 |
Total | 8 391 | 3.98 | 14 572 |
To do this, create a document in OpenOffice Writer, Microsoft Word, or an alternative software.
Then go to Stockpile Reporting and change the variables field to Write Text File and then add metadata, ie project title and date.
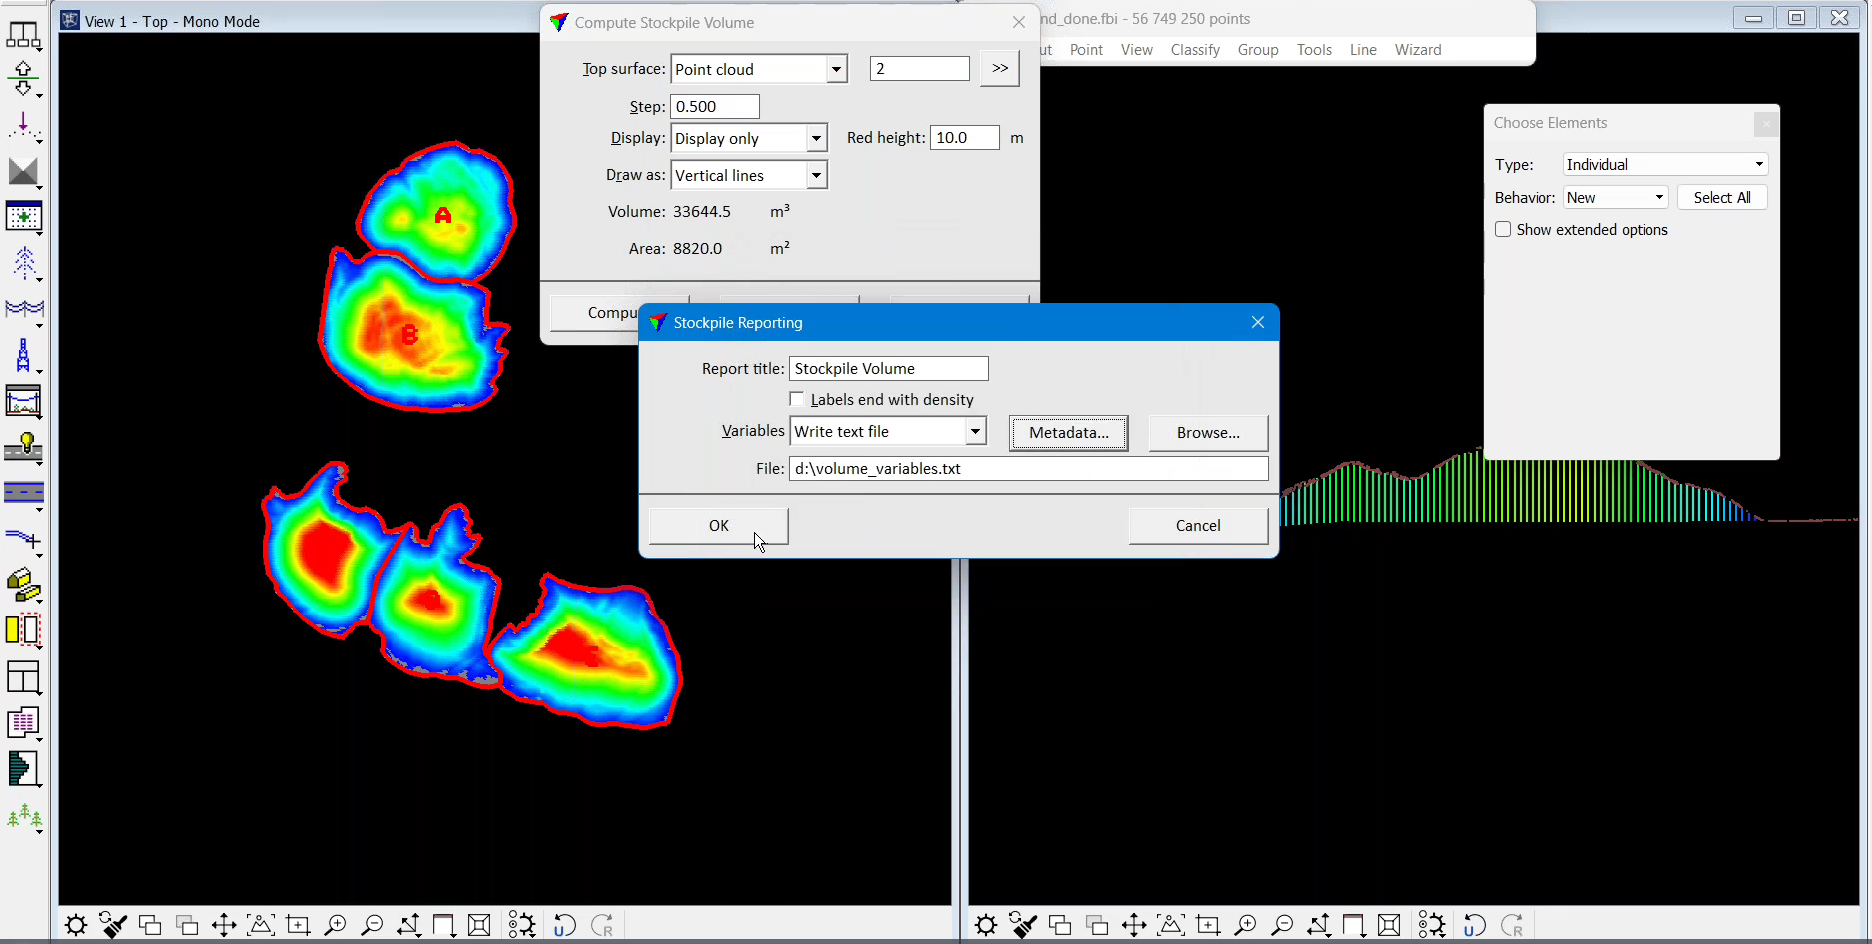
Then click the Compute button and Okay to Select Stockpile Base Polygon(s) First.
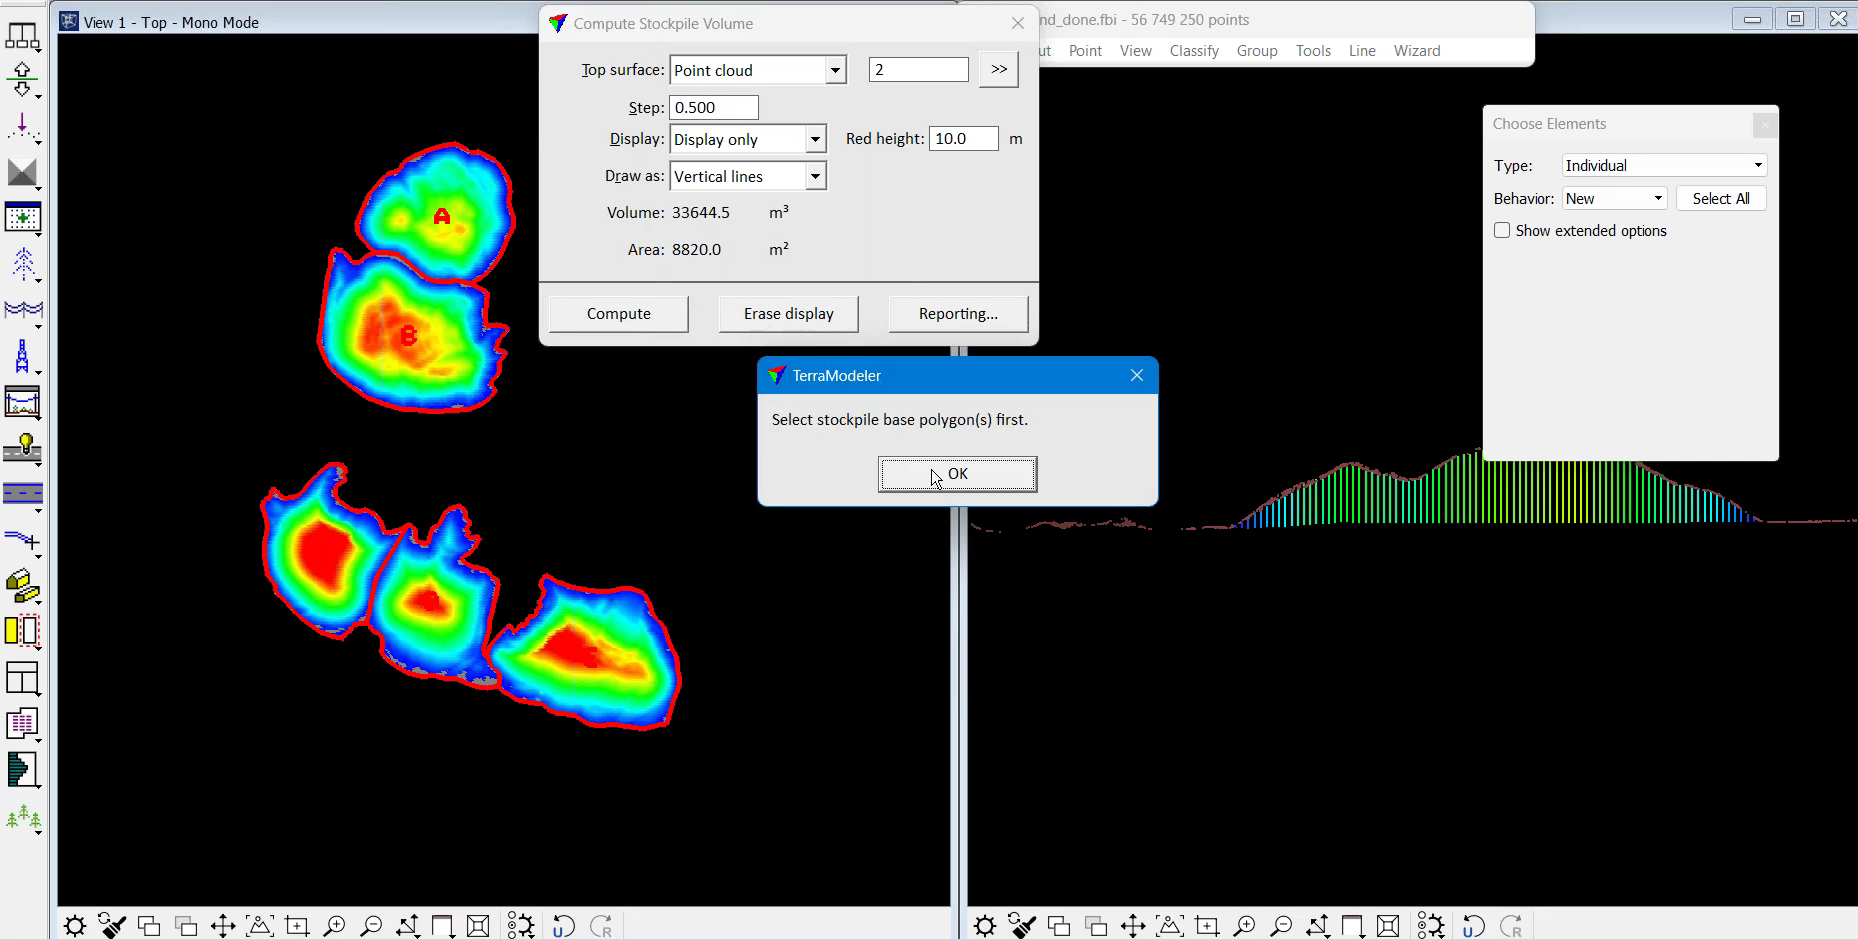
Select the relevant polygons with the labels...
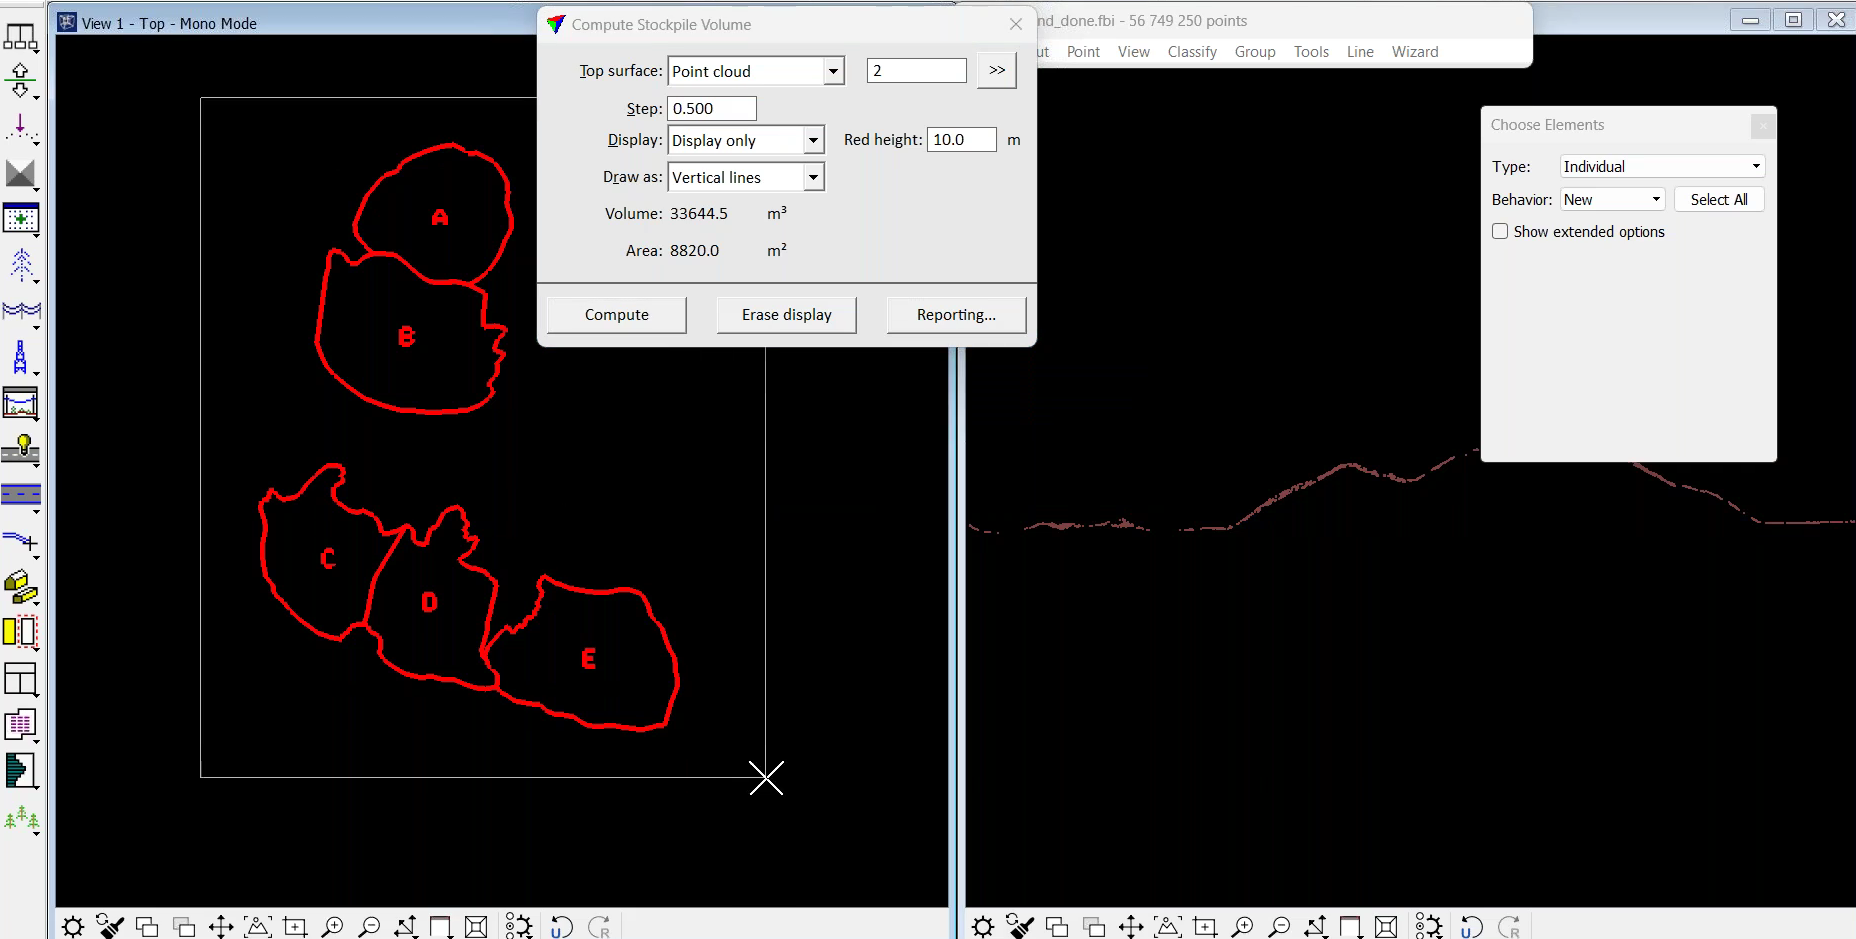
...press Compute, and this will produce a text file, which has the variable name and corresponding number in it.
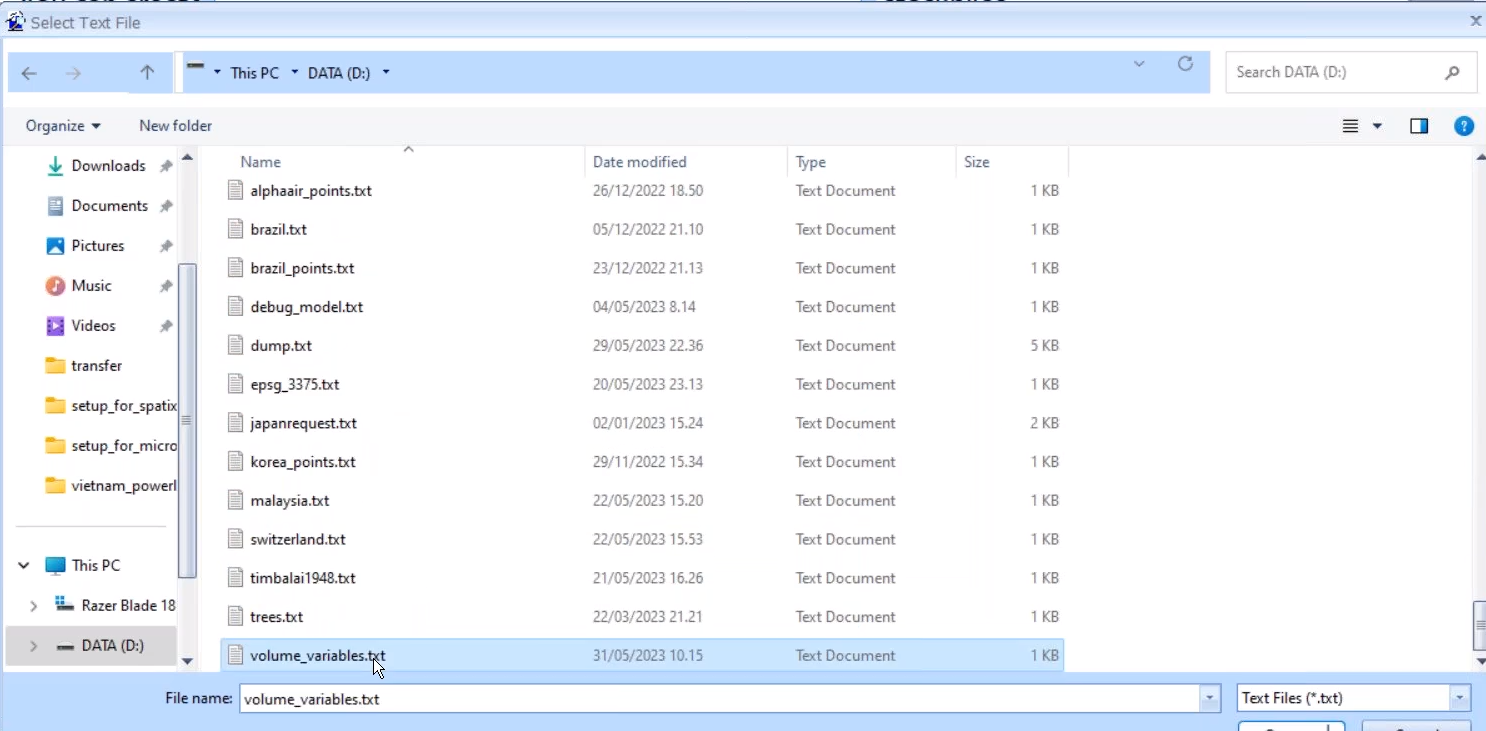
Then use the utility application and select the text file created by TerraModeler...
...and after its loads, press Start Replacing.
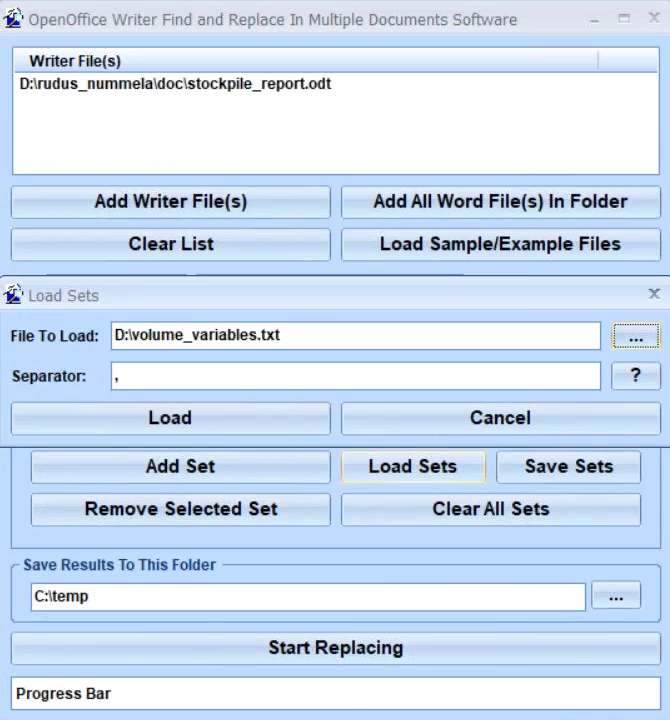
It then replaces the variables with the actual numbers that come from the TerraModeler computation to produce a completed report showing true numerical values.
Summary
The new tool in TerraModeler offers a simple and streamlined process to compute stockpile volumes directly from a LiDAR point cloud.
The simplified workflow only requires the user to conduct standard processing of the point cloud, ensure that ground has all the relevant features on the stockpiles, and draw polygons around the stockpiles.
LiDAR is an effective method to collect stockpile insights - thanks to its high levels of accuracy; dense point cloud generation to capture detailed elevation information of the stockpile surface; and its ability to obtain data in all weather conditions, lighting conditions, and times of the day.
Processing stockpile LiDAR data - including that from the DJI Zenmuse L1 - in TerraModeler provides a streamlined end-to-end workflow which can help AEC and mining organisations keep track of their onsite earthworks for better resource management, improved safety, and enhanced ROI.
heliguy™ sells the Terrasolid software ecosystem and the L1 sensor, and the in-house surveying department offers dedicated workflow support on these solutions.
The team has received in-depth training at the Terrasolid International Training Event, and created a free end-to-end workflow training course for the L1, DJI Terra, and Terrasolid - accessed here - which proved so popular, it was subsequently purchased by DJI for roll-out to its global surveying community.
To discuss anything in this article or to add these solutions to your workflows, contact us.
