News
Drone Surveying: A Guide To Point Clouds
An in-depth guide to point clouds. What they are and how they help, why drones are a great data-collection tool, LiDAR vs photogrammetry, and how point clouds can be applied to different industry applications. ... Read More

In-depth guide to point clouds, as part of the drone surveying workflow;
Find out what point clouds are and what information they contain;
LiDAR point clouds - colouring, classification and intensity;
LiDAR vs photogrammetry: Which method is best to build point clouds?
What you need to consider when post-processing point clouds;
Point clouds vs 3D models and how these digital assets are helping the world of work.
Point clouds are data-rich digital assets and are a fundamental part of drone surveying.
These virtual representations of the real world can be used to analyse elevations, distances, volumes and on-site progress to drive understanding, collaboration and decision-making.
But what actually are they, which is the best drone surveying method to create them, what do you need to consider at the post-processing stage and how do you fully utilise them? Find out in our in-depth guide to point clouds.
What Is A Point Cloud?
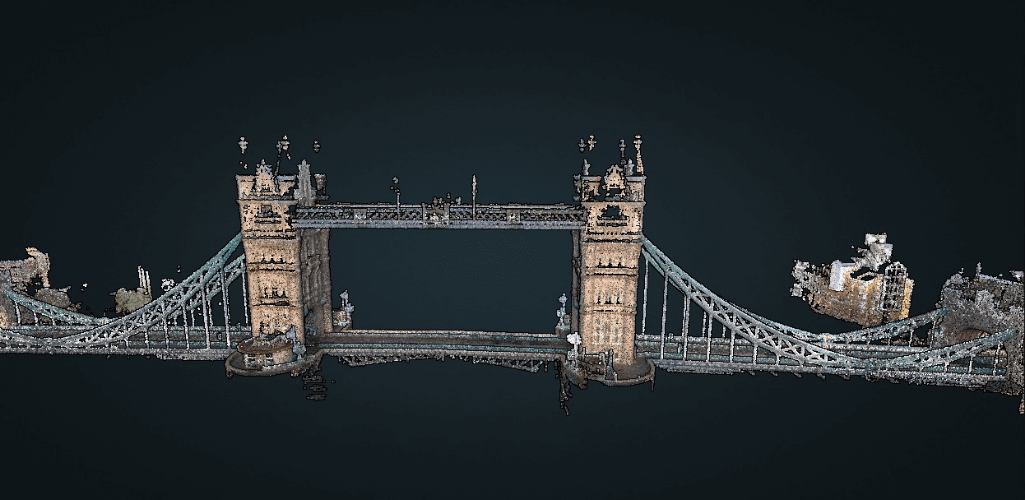
A point cloud is the representation of a geographical area, terrain, building or feature which is compiled through a huge collection of points and plotted in 3D space. And by huge collection, we tend to be talking thousands of points, if not millions!
The point cloud below - showing Tower Bridge and captured by our partners at GeoSlam - shows how all of these individual points come together to build a digital representation of the survey subject.
Notice how the digital representation looks fairly clear from afar, but as you zoom in to one of the bridge's towers, you can clearly see how the asset is made up of individual points.
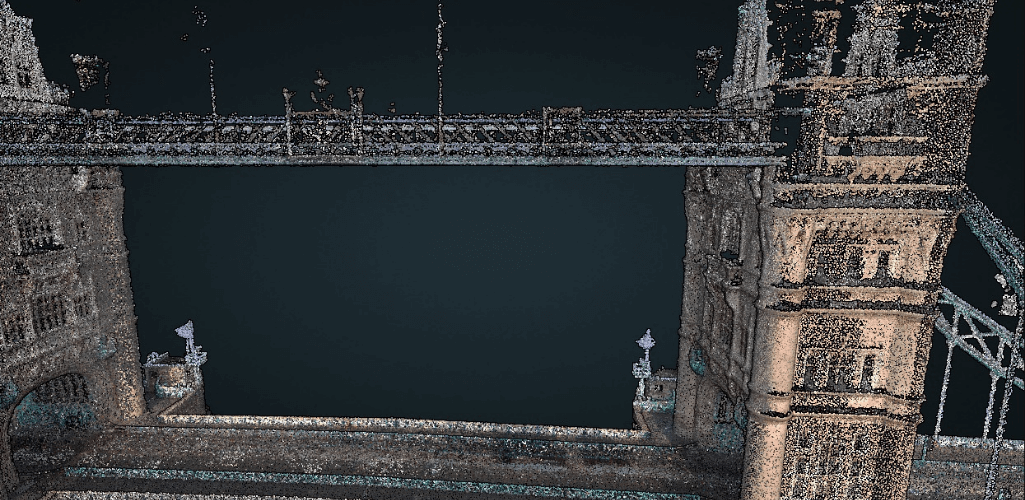
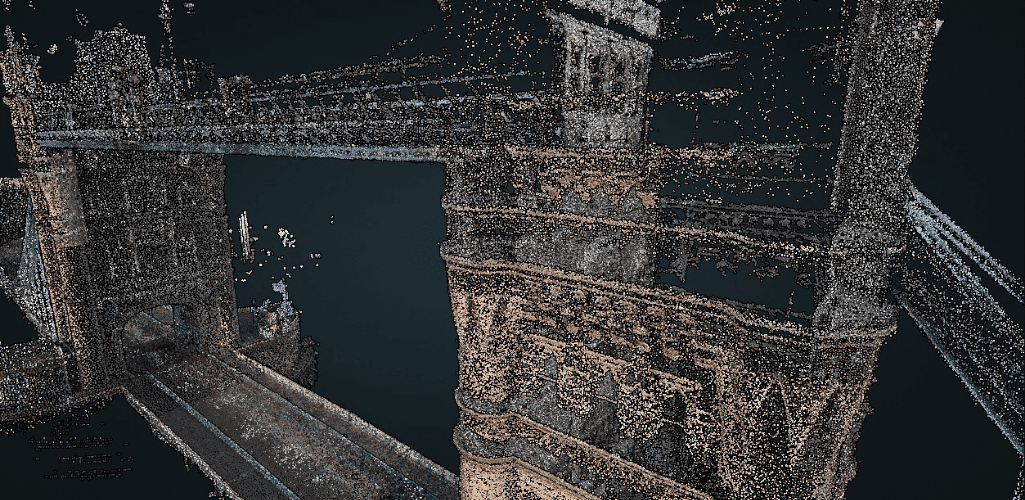
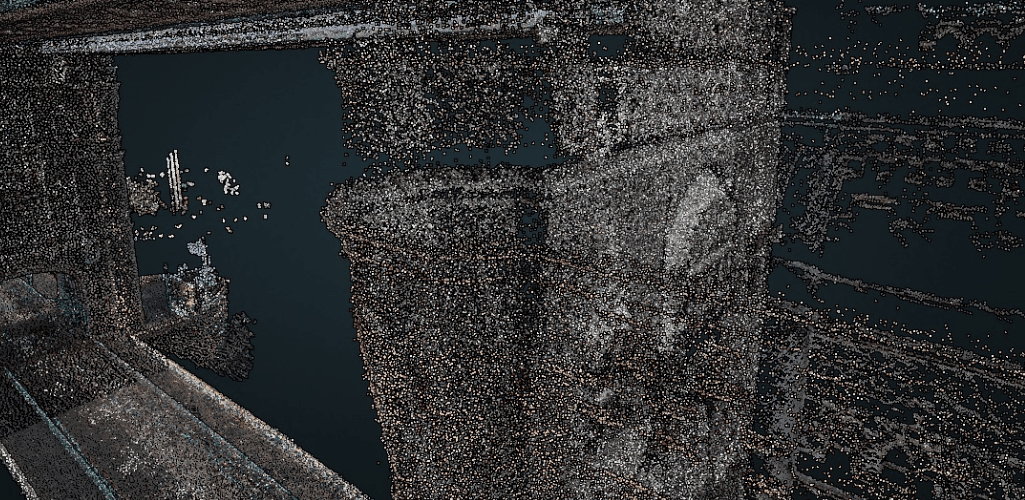
In some ways, it is very similar to pointillism, where distinct dots of colour are applied in patterns to form an image.
But these dots in a point cloud contain a huge amount of information, For instance, each point has its own set of Cartesian coordinates (X, Y, Z)...
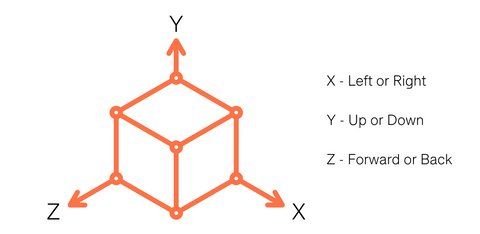
...and each virtual georeferenced point represents its real-world equivalent, such as a section of wall, ground or road etc.
For this reason, point clouds can be used to measure an object's depth, elevation, shape and exact geolocation.
Point Cloud Colourisation - RGB And Intensity
Point clouds can also contain colour values, such as RGB and intensity.
However, the surveying method you use will ultimately decide which of these values your point cloud has.
These surveying methods are split between LiDAR and photogrammetry, which will be discussed in more detail later.
RGB
Photogrammetry will contain RGB information for each point because this data-collection method involves taking high-resolution photographs of your survey site, area, or object. Consequently, your files will contain the colour which is contained with each image.
In contrast, a LiDAR data set does not automatically contain RGB information. However, individual points can be tagged with an RGB value in a process known as colourising the point cloud.
This can be done by:
Adding true colours that correspond to the real environment.
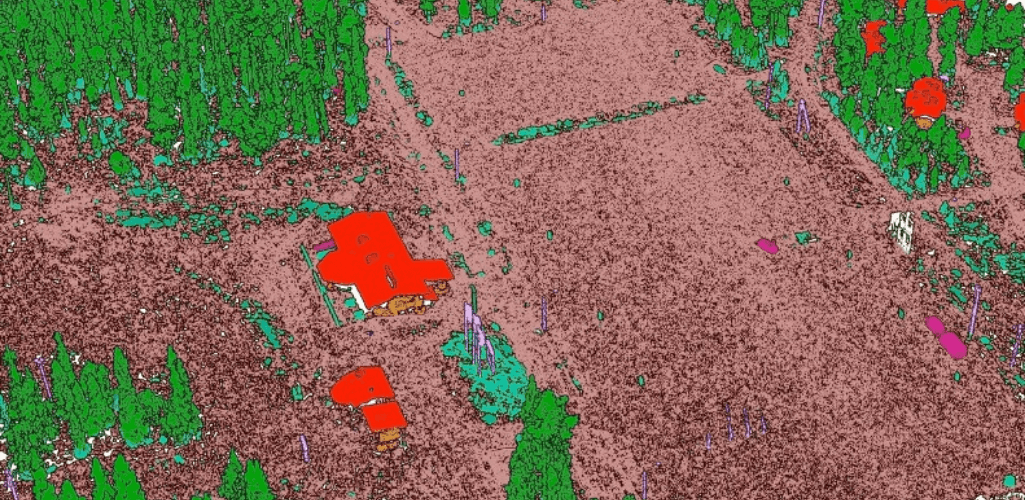
Classifying objects by assigning specific colours to simplify visual review of the models. The image below shows a point cloud which has been classified in the Terrasolid software platform: Notice how the features have been colored based on their specific class category, such as red for roof tops, green for trees, and a brownish colour for the ground. Find out more about point cloud classification here.
However, some LiDAR sensors - such as DJI's L1 - have photogrammetry capabilities. In the case of the L1, the sensor is able to provide real-time colour information for the point cloud data during the scanning process. This allows the L1 to output true colour point clouds and reality models.
Operators using the GeoSLAM ZEB Horizon LiDAR scanner can add real-world colour to their point clouds by using the ZEB Vision accessory.
RGB (imagery) or the addition of true colour/classification is a powerful tool for visualising your data set and for providing additional information for rendering and interpreting the data.
Intensity
A point cloud can also be colourised based on intensity, but by its very nature, this is limited to a LiDAR/laser scan, and not something which is present in a photogrammetric point cloud - as photogrammetry does not have reflectance values, it only captures the image it sees.
Intensity represents the strength of the return signal from the LiDAR scanner for each point and is particularly effective for surveys where feature detection or land classification is important.
It can be influenced by several factors, such as:
Target properties (material, reflectivity)
Range to the target (longer range = weaker return)
Wet/dry surfaces behave differently
Intensity is useful as it adds colour to the data, can be used to identify different materials/surfaces, and enables better interpretation of a data set.
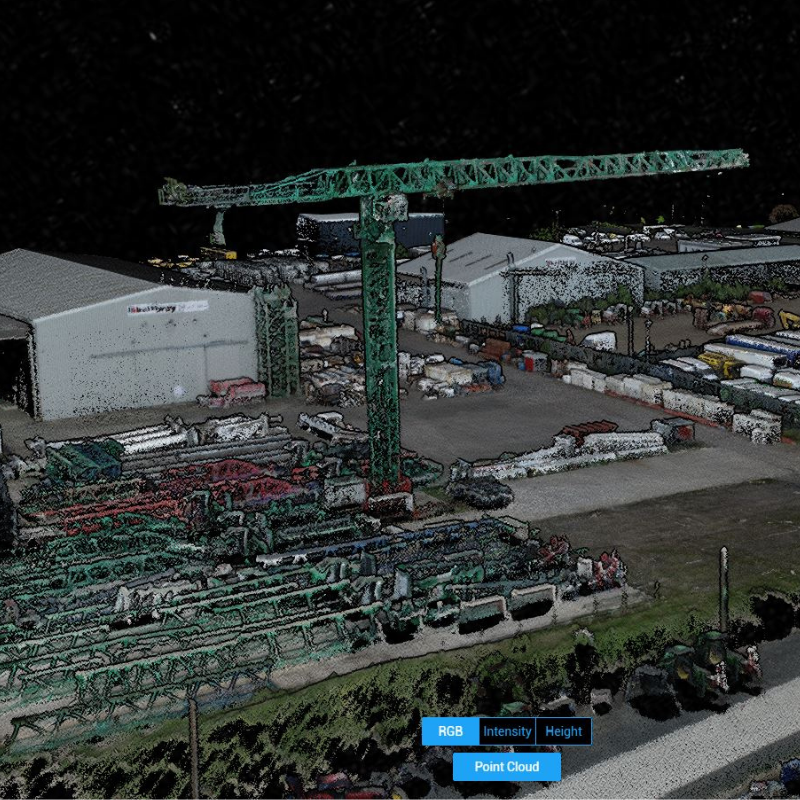
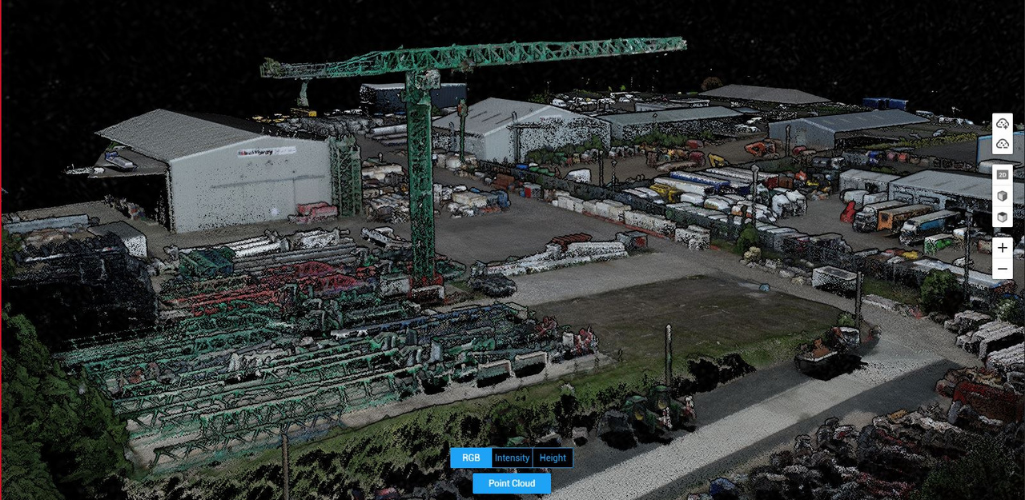
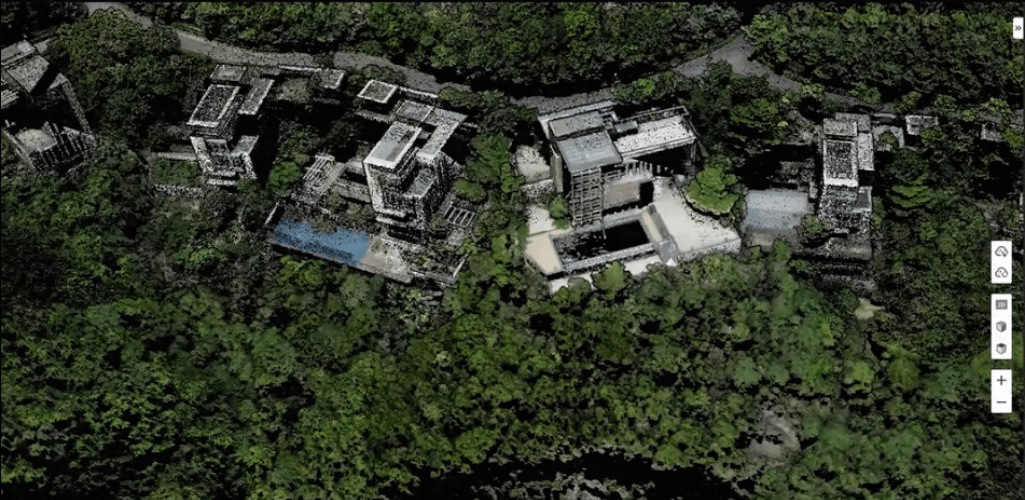
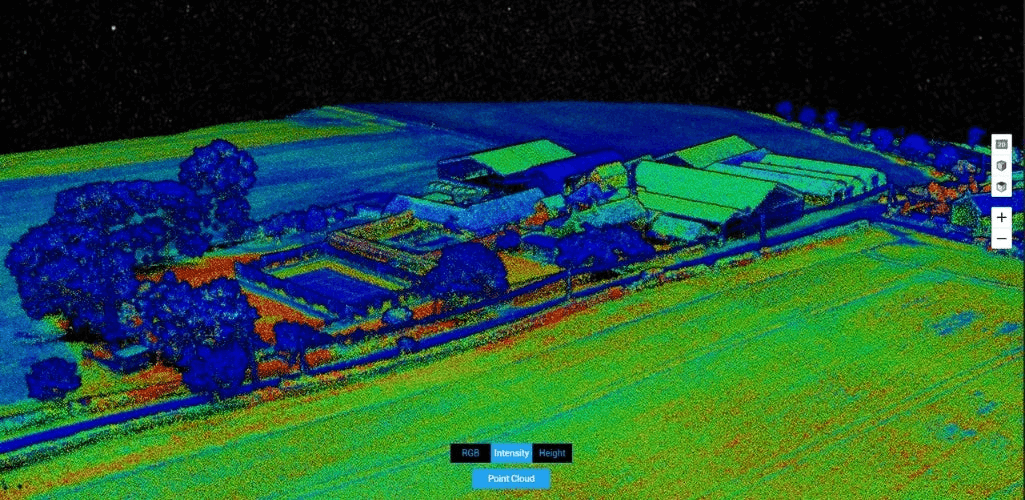
With colour in mind, and as far as LiDAR is concerned, look how the raw point cloud changes when toggling between RGB...
...and intensity.
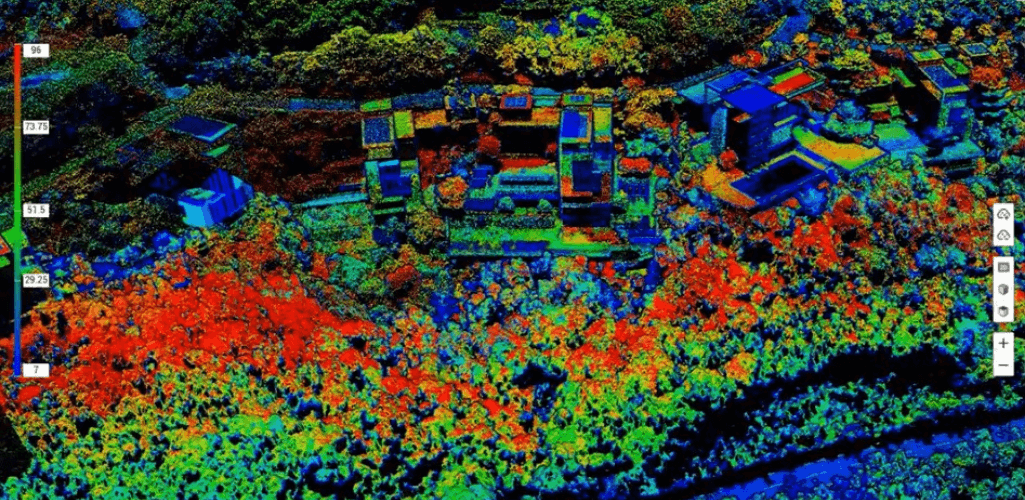
The RGB/intensity point clouds were processed in DJI Terra using L1 data. The same point cloud can also be coloured based on the survey area's height...
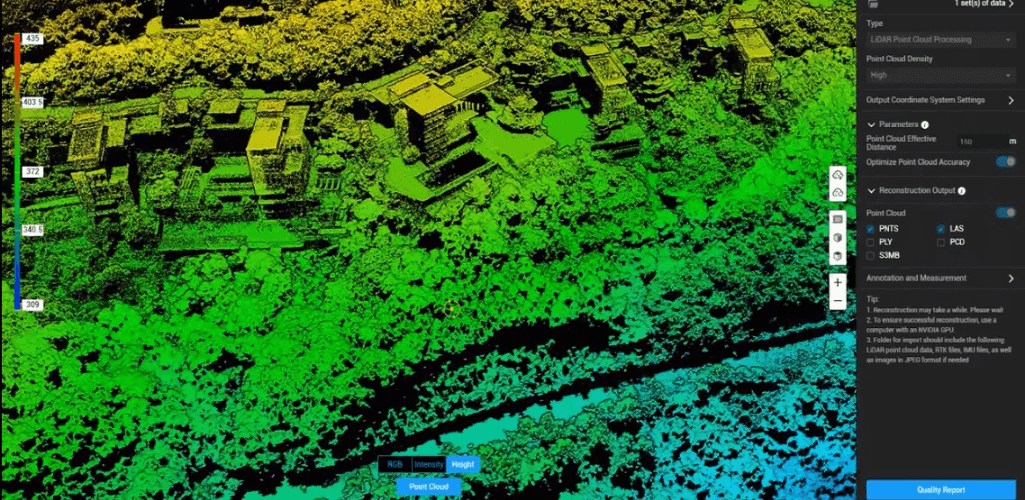
...and echoes, which highlight the number of laser returns when collecting the data.
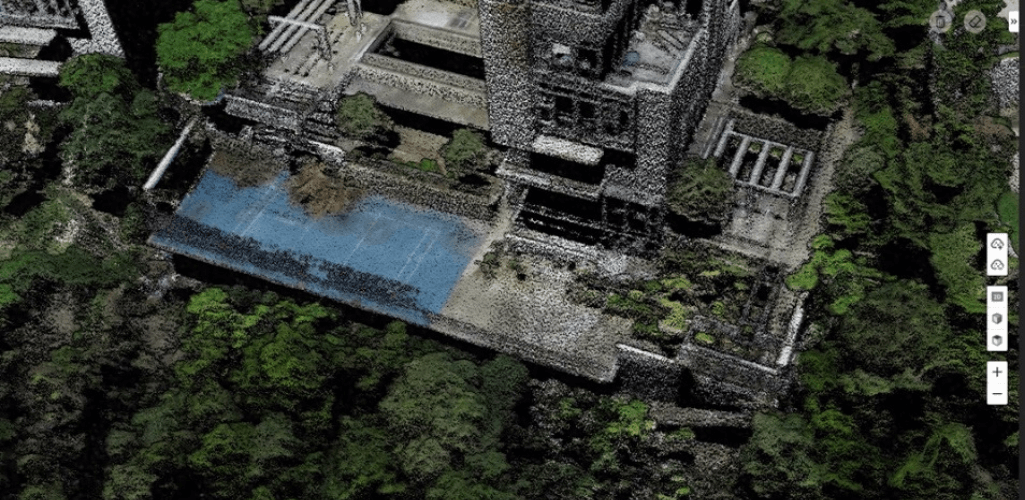
Viewing a point cloud by the number of returns is useful for seeing which areas have received either a dual or triple return. Areas that have dual or triple returns will usually be in areas of vegetation, or on the corners of buildings, as the surface is not completely blocking the path of the LiDAR pulse.
These different colour options enable the point cloud to be analysed in different ways.
Building Robust Point Clouds
Point clouds are made up of exactly that - points. Therefore, the denser the points in your digital asset, the more accurate and detailed your data set will be.
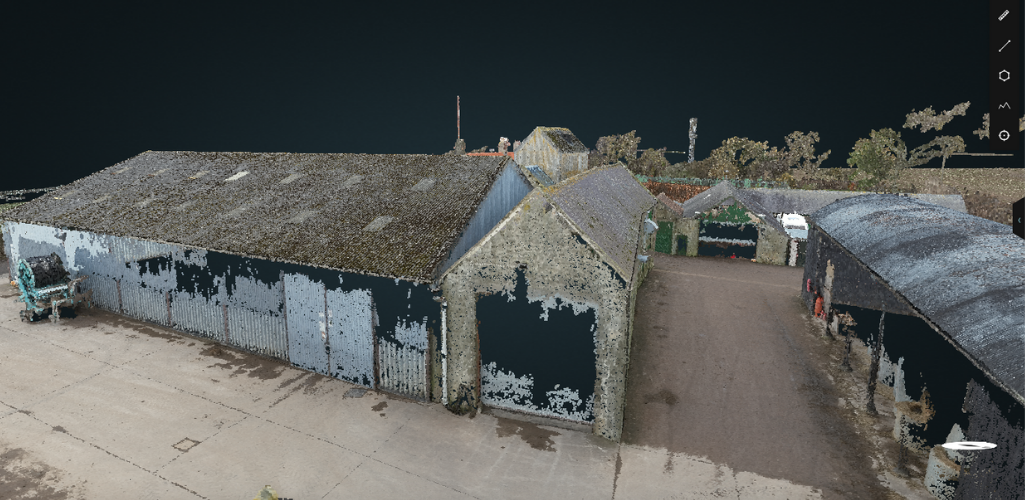
With this in mind, your survey area will sometimes need to be scanned multiple times, or from a number of different angles, to construct a denser point cloud and avoid what are known as data gaps. After all, the points can only be captured within the sensor's line of sight.
For instance, look at how data gaps impact sections of this point cloud, with parts of the shed's wall missing.
Drones help collect this information quickly and safely, utilising different flight plans to capture data from various angles. Crucially, they can carry LiDAR sensors and photogrammetry cameras, which are essential to creating a quality point cloud.
It is worth noting that drones aren't the only method of building point clouds: Terrestrial laser scan systems can also be used to collect the data.
Creating A Point Cloud: LiDAR Versus Photogrammetry
We touched on it earlier, but the principal methods of collecting point cloud drone data are LiDAR and photogrammetry.
LiDAR works by sending pulses of light to the earth's surface or a feature on it and measuring the time it takes to reflect back. This provides an accurate positioning point of where on the earth's surface the laser hit, helping to build a detailed visualisation of what the sensor has scanned.
Photogrammetry captures high-resolution photographs to recreate a survey area, with distinct features overlapping in numerous images. The location of each feature is then measured using triangulation (determining a 3D object's coordinates by using photographs to cover the same object but from different positions).
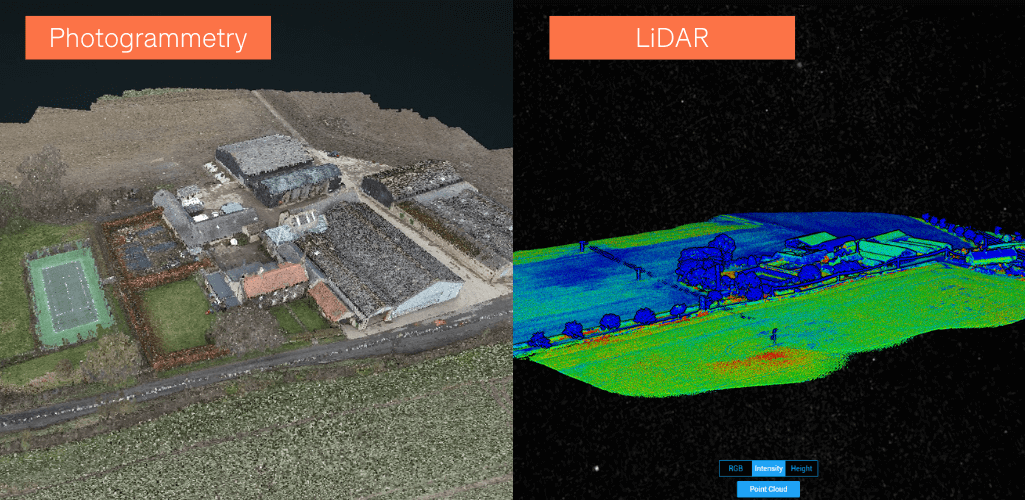
Because LiDAR uses laser pulses and photogrammetry captures real-world imagery, the outputs are significantly different. For instance, compare these point clouds of the same building...
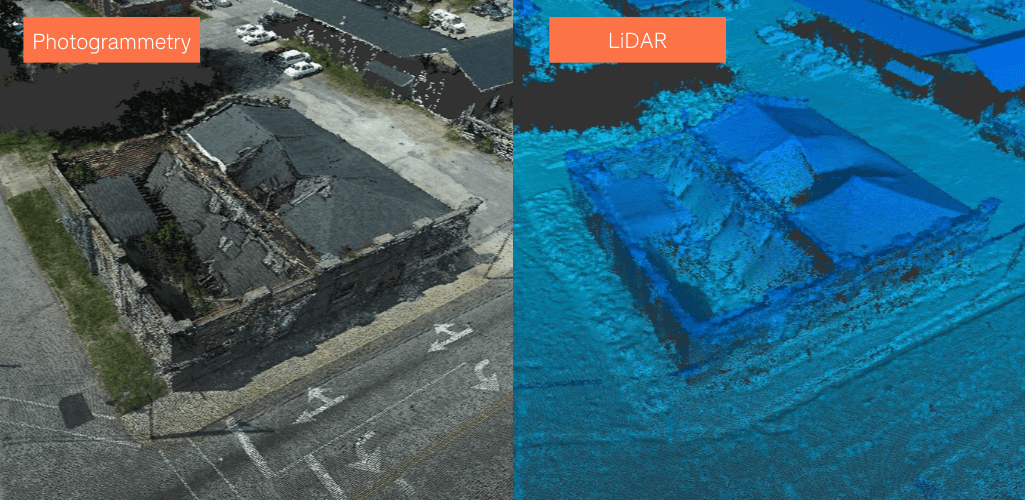
...and notice how photogrammetry is better-suited at capturing the visual details of the survey area.
However, that is just one factor to consider, and the truth is, LiDAR and photogrammetry are both powerful drone surveying tools. The table below gives an overview of each application's pros and cons, but you can find out more by reading our in-depth LiDAR vs photogrammetry blog.
Photogrammetry | LiDAR |
+ Cost effective (hardware and software tends to be cheaper) | + Best solution for mapping areas of dense vegetation and for building DTMs and topographic maps |
+ User-friendly - a good barrier to entry for drone surveying | + Works in low-light conditions or at night |
+ Builds photorealistic maps and models, making data sets easier to interpret. Also provides a 3D model straight away alongside the point cloud. The data can also be used to build 2D orthomosaics. | + Picks up tiny details, such as thin wires or cabling |
- Needs a good light source | + Quicker processing time because of smaller file sizes |
- Longer processing times because of high-res imagery | - Can be expensive and require more expertise |
- Some finer points in a survey area can be missed, such as thin wires | - Point clouds can lack colour and detail |
Point Cloud Post-Processing
Once you've collected your data, you will need to post-process your point cloud.
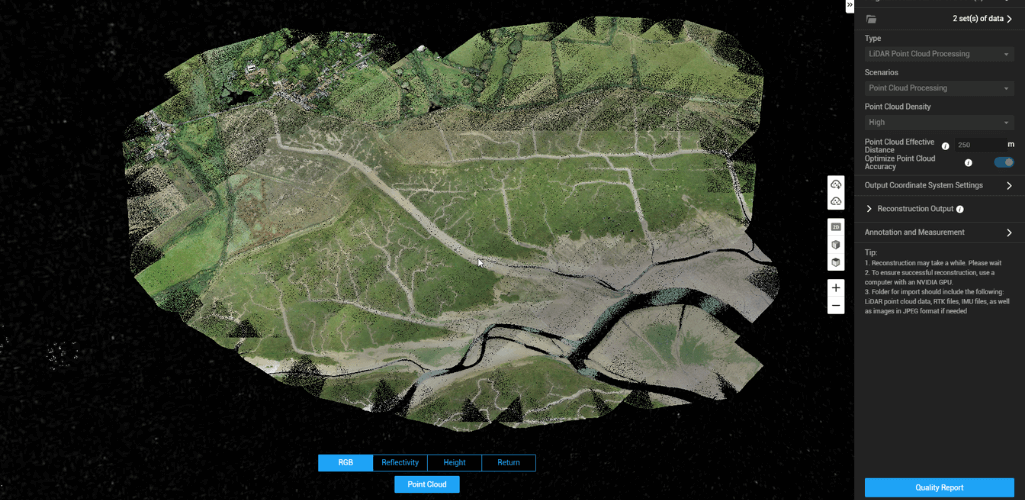
This is done by uploading your raw files into a software such as DJI Terra. Our in-depth guide to post-processing LiDAR data in DJI Terra details this workflow.
As far as LiDAR is concerned, you can then move your processed point cloud into a platform like Terrasolid to conduct further cleaning, classifying and analysis.
The image below shows the data set, pre-and-post classification. The raw point cloud (left graphic) was initially processed through DJI Terra and then put into Terrasolid for cleaning and classification (right image).
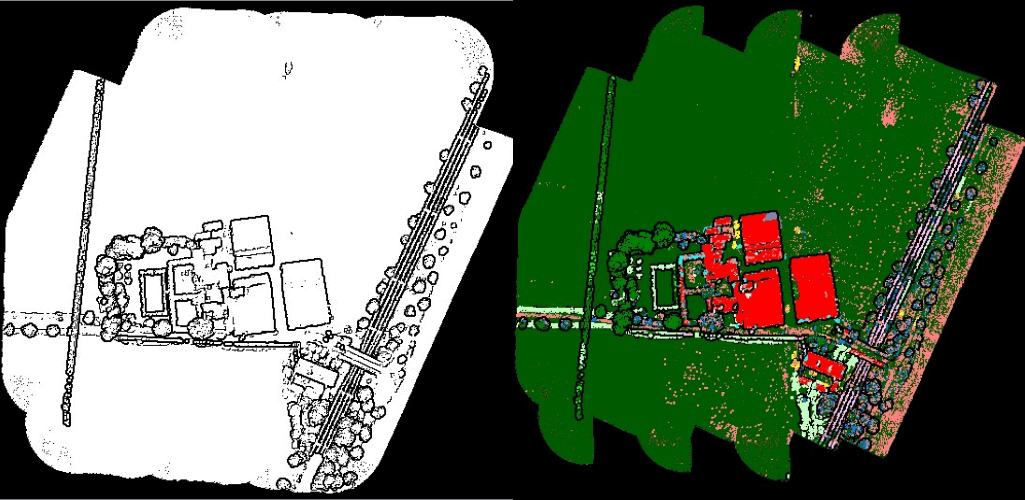
It is worth noting that different drone payloads produce raw data in multiple formats, and each piece of software has different exporting capabilities. Popular formats for LiDAR include LAS, pts, PTX, and XYZ. Likewise, photogrammetry files include OBJ, OSGB, s3mb, i3S and PLY.
It may also be necessary to apply coordinate transformation during the post-processing stage. Taking the L1 as an example, the georeferenced raw point cloud data is collected in WGS-84, but is changed to OSGB36 in Terrasolid.
Terrasolid also provides other projected and geodetic coordinate systems. It may also be necessary to import a geoid model. For Terrestrial Laser Scanners you will have to register the point cloud to do the coordinate transformation.
To help georeference photogrammetry data to create a point cloud file, you can use ground control points in the reconstruction, or you can export the drone's positional data and edit the EXIF data in a third-party software.
You can find out more about georeferencing and post-processing point clouds on the heliguy™ Geospatial Workflow Courses.
Once your point cloud has been post-processed, you can begin to build outputs such as 3D models, text meshes or fly-throughs.
3D Point Cloud Vs 3D Model
A 3D point cloud is different to a 3D model, but they can be part of the same process.
In other words, a 3D point cloud is used to build a 3D model, should you need one. More of this later.
The process of capturing a high-density point cloud to create a 3D model is called Scan to BIM, whereby scan data is imported into a 3D modelling environment to create an accurately-built model and to inform the design with real-world conditions.
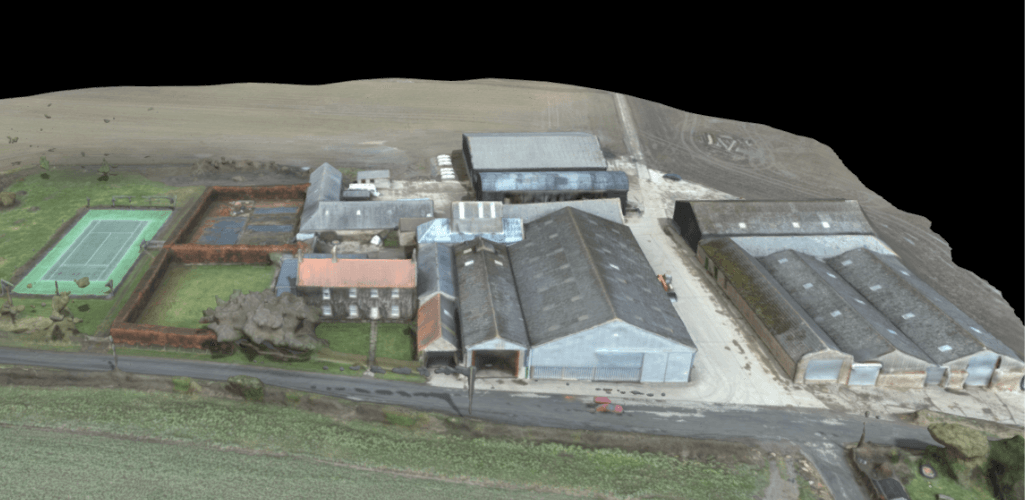
The difference between a point cloud and 3D model is seen by looking at the two images below, taken from a photogrammetry survery.
The first is a 3D point cloud, which shows the survey scene compiled of points.
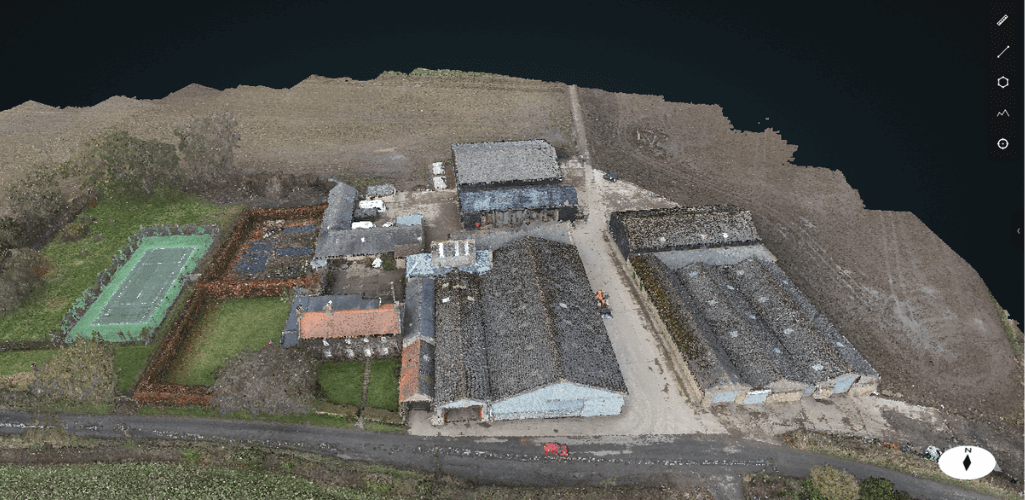
But the second image shows a much neater, smoother model, which is a much more realistic representation of the survey site and improves the aesthetics of the digital asset.
Actionable Data From Point Clouds And 3D Models
3D models and point clouds are vital for numerous reasons, enabling professionals to analyse their site, conduct calculations and make real-time decisions.
Construction:
These digital assets can be used to conduct stockpile calculations and cut and fill analysis. Find out more in our guide to using drones for stockpile calculations.
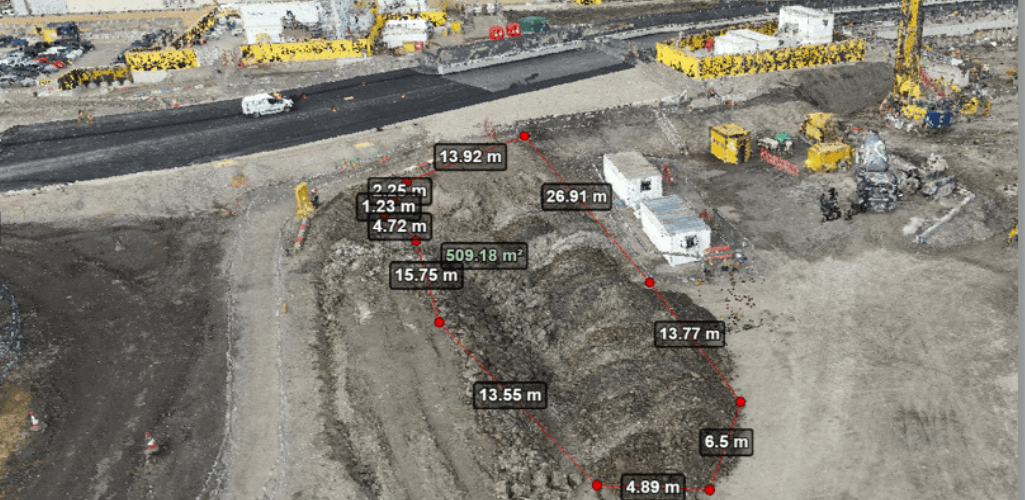
They can also be used to build 3D reconstructions of the site to monitor progress and spot mistakes.
Utilities:
Drones help massively with accessing tough-to-reach areas or dangerous parts of an asset. Why clamber up a powerline when a drone can collect the data for you, enabling you to use a 3D model to conduct inspection, for instance.
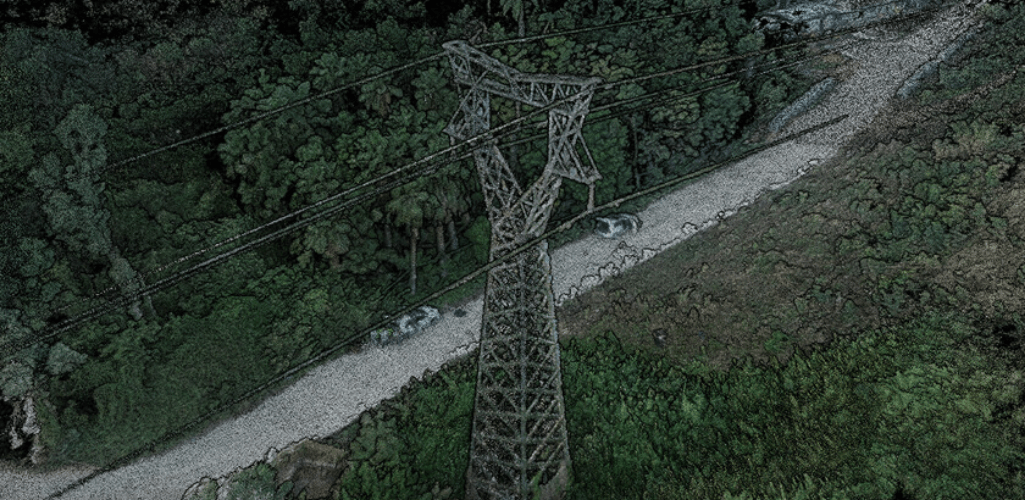
The asset can also be kept live, reducing or even limiting downtime altogether.
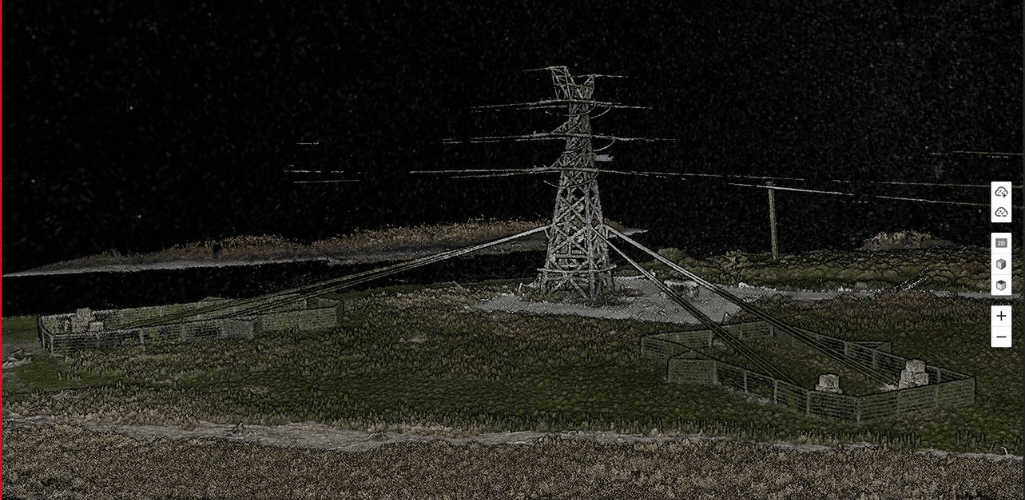
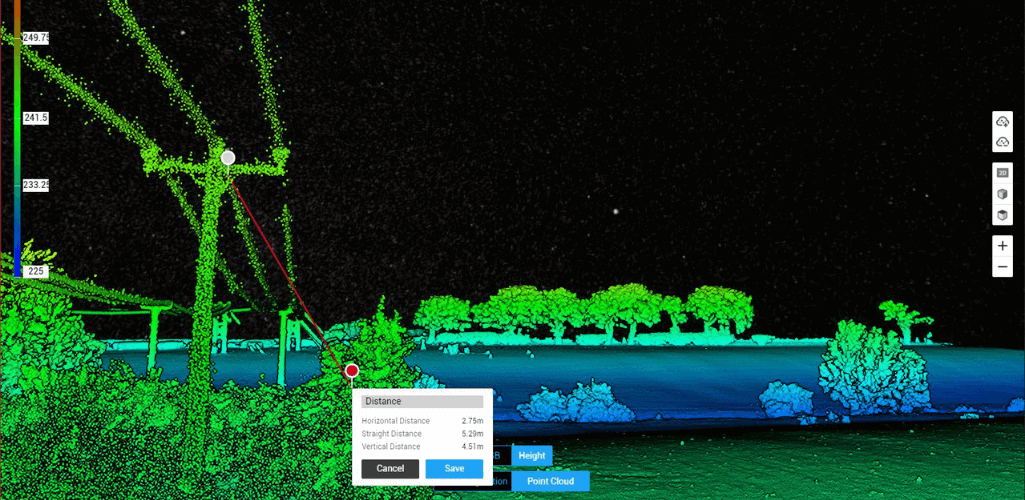
Highly-detailed maps and models can also be used to enhance mission planning, while LiDAR models enable measurements between powerlines and vegetation, as this image shows below.
For an in-depth guide on using point clouds for utilities, read our case study with Aureos.
Oil And Gas
Digital twins are powerful assets to have for oil and gas. They can be used for integrity planning, predictive maintenance, improving the situational awareness of staff and contractors, and enhancing logistic optimisation.
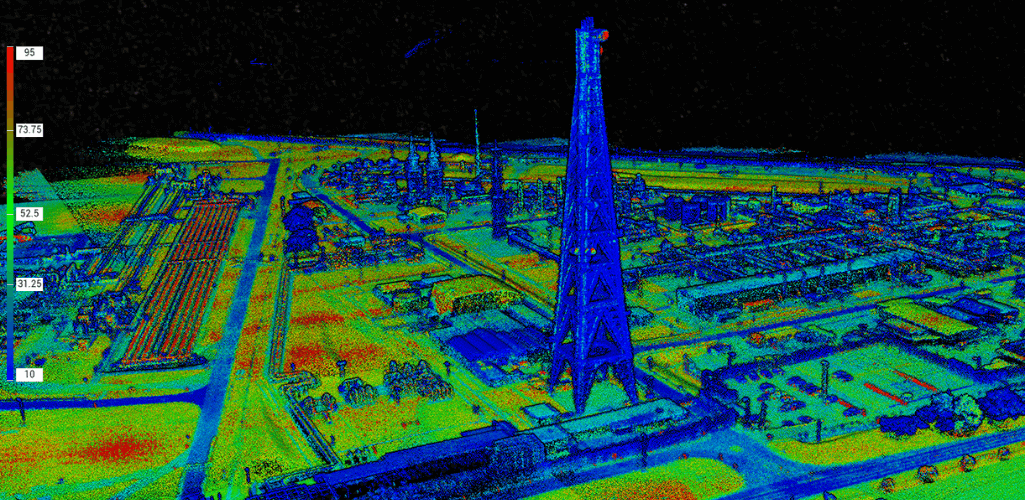
Find out more by reading a case study involving Shell and Bilfinger.
Public Safety
The emergency services can utilise drone mapping for crash-scene investigation, evidence gathering and mission planning ahead of deployment.
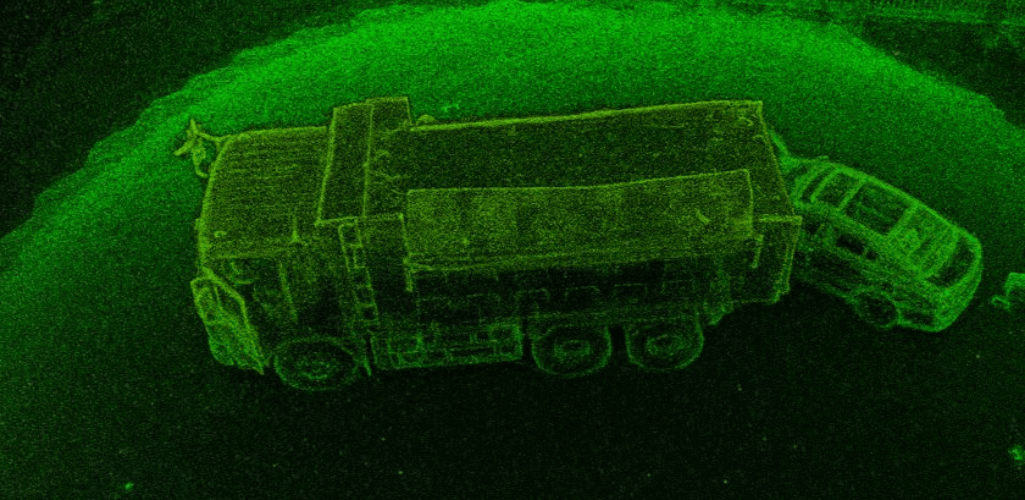
Find out more in our guide to using LiDAR for public safety or our blog about using photogrammetry for crash-scene reconstruction.
Best Drones And Payloads For Creating Point Clouds
The DJI surveying ecosystem provides high-quality solutions to build robust point clouds.
M300 RTK
DJI's most powerful enterprise drone, the M300 RTK offers an efficient drone surveying solution - especially over larger sites. Read this report to see just how efficient it can be for surveying.
Its IP45 rating ensures that drone mapping missions can be completed in difficult weather conditions.
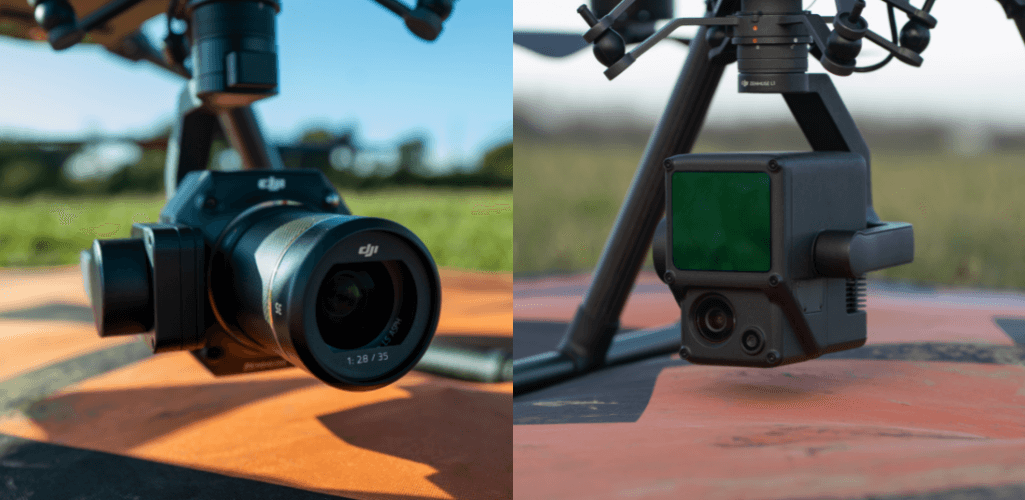
The drone can be integrated with the P1 45MP full-frame sensor (below, left) for photogrammetry data, or the L1 LiDAR sensor (below, right), which supports up to three returns and real-time point cloud generation.
The M300 RTK can also be integrated with non-DJI payloads, including the GeoSlam Zeb Horizon LiDAR sensor. The plug-and-play payload is pictured below, integrated with a DJI M600 aircraft.
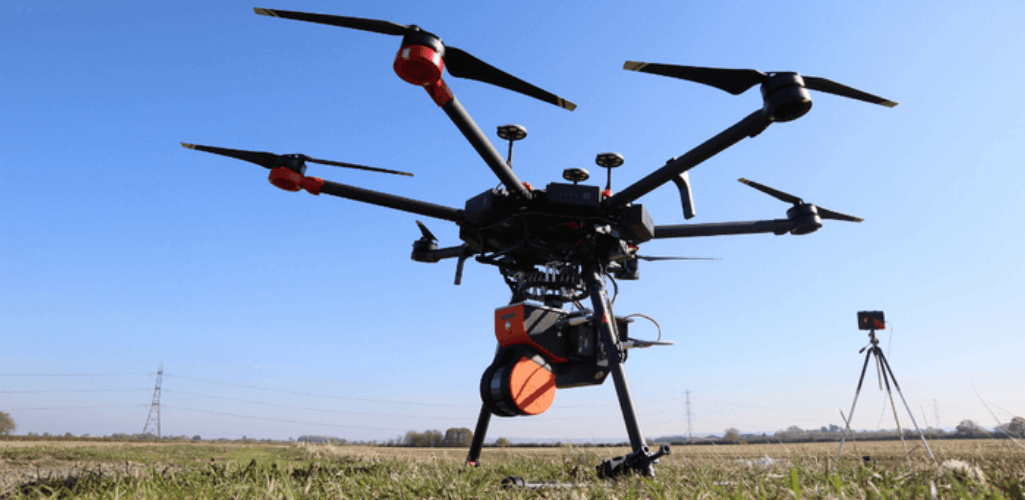
This industry-leading solution has a 100m range and can capture 300,000 points per second with an accuracy of 1-3cm.
Phantom 4 RTK
The DJI Phantom 4 RTK is a dedicated, all-in-one drone mapping solution. It is especially suited to low-altitude or smaller-area surveying, and is an ideal entry-level aircraft for drone mapping.
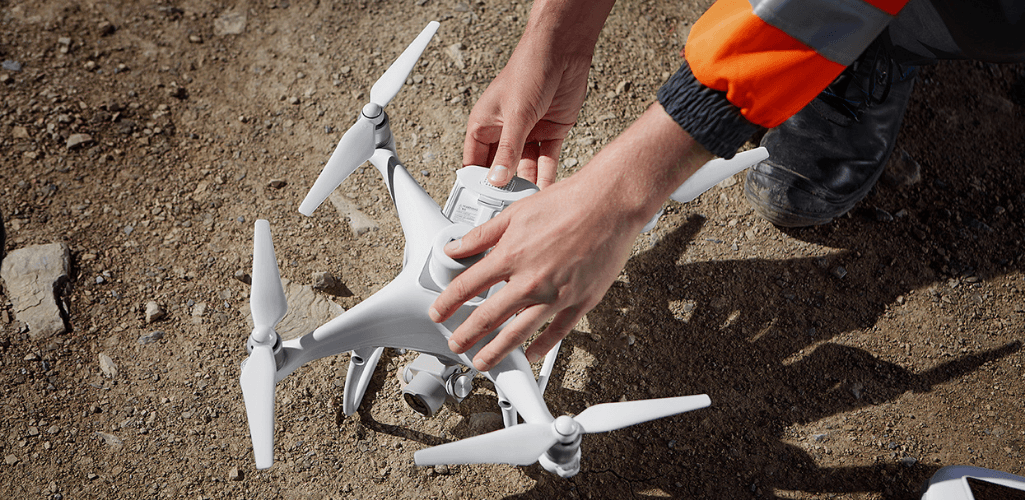
It benefits from a 20MP sensor for photogrammetry, and an in-built RTK module providing real-time, centimetre-level positioning data for improved absolute accuracy on image metadata.
Point Clouds: Summary
Point clouds are a vital component of a modern day surveying workflow and drones help to collect the necessary data efficiently and accurately.
These virtual assets provide a deep understanding of a jobsite or mapping area and can be used to conduct measurements, analysis and other observations, which drives decision-making and ROI.
GIS specialist heliguy™ provides the hardware and software solutions to build robust point clouds and provides dedicated training to help aerial surveyors maximise their data collection and fully utilise point clouds. For more information, contact us.
